
Business Intelligence Platform Guide: Top 5 Options in 2026

Last Updated: March 21, 2026
Key Takeaways
- Business intelligence platforms unify data from multiple sources into dashboards and reports that drive faster decisions
- Market leaders in 2026 are Power BI (affordable, Microsoft-integrated), Tableau (visualization excellence), and Looker (cloud governance)
- 73% of BI implementations fail to deliver ROI because companies choose platforms based on features rather than business outcomes
- Modern BI platforms now include AI agents that can automate insights and trigger actions, moving beyond static dashboards
- True BI success requires choosing the right platform for your ecosystem, then building a data-driven culture that acts on insights
What Is a Business Intelligence Platform?
A business intelligence platform is fundamentally a system that collects data from across your organization, transforms it into something meaningful, and presents it in ways that actually inform decisions. According to Atlassian, a BI platform gathers, analyzes, and visualizes data to support informed decision-making. That's the simple version. The practical version is more nuanced: these platforms handle data integration from multiple sources, build models that reveal patterns, create visualizations people can understand, and generate reports that matter.
The core functions rarely vary. Every serious BI platform does four things: pulls data from your systems, cleans and structures it, builds dashboards and reports, and serves insights to decision-makers. The differences emerge in how well they do each of these, and how accessible they make the process for non-technical users.

Why does this matter? Because speed wins in business. Companies that move from "I wonder what happened" to "here's what happened and why" in hours instead of weeks gain measurable competitive advantages. As industry analysis notes, BI is no longer optional; it's a core foundation for how organizations operate, compete, and grow.
Yet here's the uncomfortable truth: most organizations have a BI platform sitting underutilized. They bought the software, built some dashboards, and then watched adoption plateau. The platform itself isn't the problem. Usually, it's either the wrong tool for their specific needs or the organization lacks the structure to actually act on what the data reveals. That's the gap we'll address in this guide.
Why Businesses Need BI Platforms in 2026
The business case for BI platforms has never been stronger. The global BI market is estimated at USD 41.16 billion in 2026 and projected to reach USD 62.38 billion by 2031, reflecting genuine demand from organizations desperate to compete on data. Companies that operate with real-time insights consistently outpace their competitors in revenue growth, customer retention, and operational efficiency. Speed matters now more than ever.
Yet here's the uncomfortable truth: 73% of BI implementations fail to deliver expected ROI within the first year. That's not a small margin of error. It's a pattern. Organizations invest heavily in platforms, integrate their data, build dashboards, and then watch adoption stall or insights go unused. The tools themselves aren't the problem; misalignment between technology, process, and business strategy is.
The paradox is revealing. 91% of BI users say these tools significantly improve decisions, especially for financial reporting and planning. So BI works when it works. The gap between potential and reality comes down to execution: choosing the right platform for your specific needs, not just the most popular one.
What's changed in 2026 is the integration of AI agents into BI workflows. Nearly 40% of enterprise applications now include AI capabilities, enabling predictive analysis and automated insights that go beyond passive dashboards. Real-time decision-making replaces manual reporting cycles. Teams stop reacting to yesterday's data and start shaping tomorrow's outcomes.
The urgency is real, but so is the risk. The following sections cut through the noise and show you how to evaluate platforms based on what actually drives revenue growth, not just feature lists.
Key Features of Modern BI Platforms
When you're evaluating a business intelligence platform, focus on capabilities that actually connect data to decisions. The foundation starts with data integration: a solid BI tool should pull from databases, cloud services, SaaS applications, and yes, even spreadsheets without requiring a data engineer for every connection. This flexibility matters because your data lives everywhere.
The second pillar is self-service analytics. As Atlassian explains, if you want a culture of democratized data, you need a BI platform that's easy for everyone to use. When non-technical team members can build their own reports without IT bottlenecks, insights move faster and decisions improve.
Real-time dashboards and alerts keep you responsive. Instead of weekly reports, you monitor KPIs as they happen and catch emerging issues before they become problems. This matters especially for revenue-critical metrics.
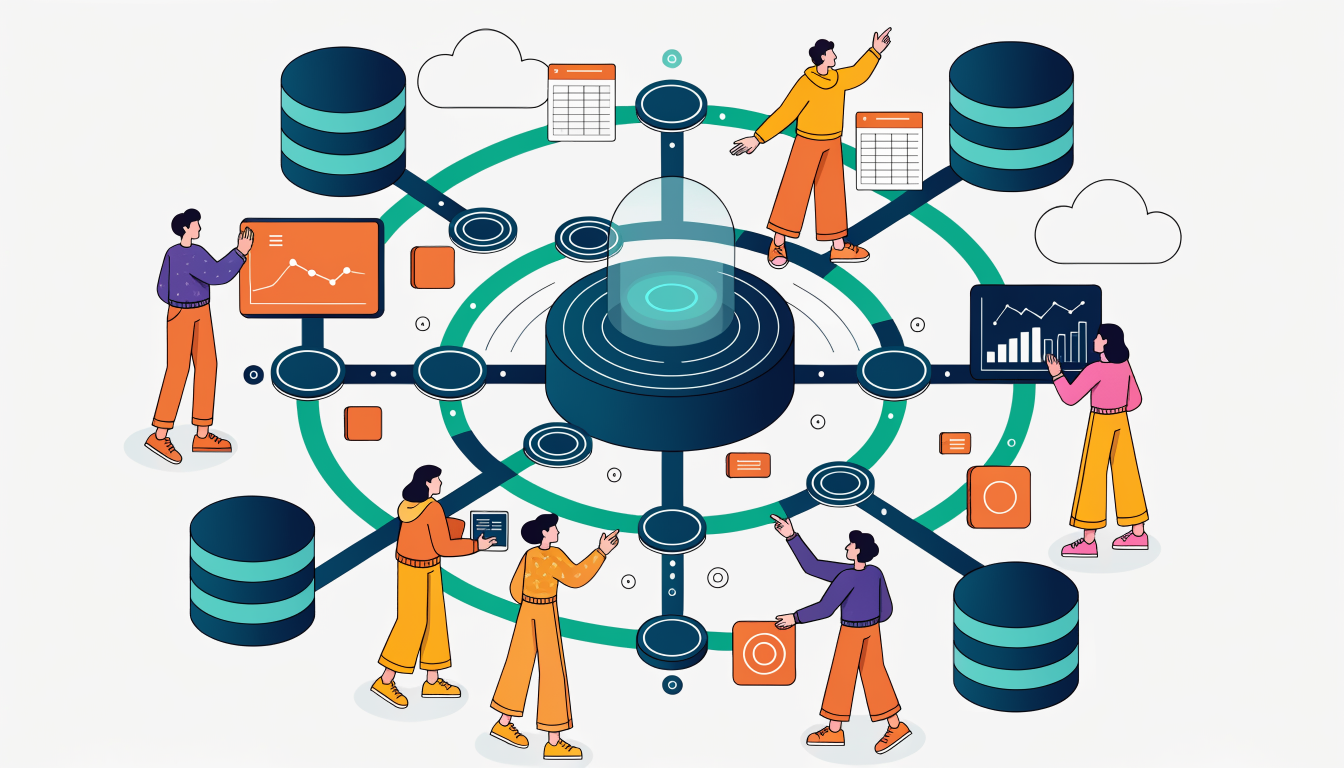
Data governance keeps everything consistent, secure, and compliant across your organization. Without it, teams end up with conflicting numbers and compliance headaches.
Finally, look for AI and automation features: natural language queries let you ask questions in plain English, while anomaly detection surfaces unexpected patterns automatically. Collaboration tools ensure findings actually drive team decisions rather than sitting in dashboards nobody discusses.
Top Business Intelligence Platforms Compared
The market for business intelligence platforms has consolidated around a few dominant players, each with distinct strengths and meaningful trade-offs. Understanding where each excels matters far more than chasing the "best" label.
Power BI leads in affordability and Microsoft integration. If your organization runs on Office 365, SQL Server, and Azure, Power BI practically sells itself. You'll find strong real-time dashboard capabilities, seamless data connectivity, and a price point that won't require executive approval. The catch: its visualization flexibility lags behind competitors, and building complex analytical experiences can feel clunky compared to purpose-built alternatives. Power BI dominates with 20% market share, largely due to this ecosystem advantage.
Tableau represents the opposite philosophy: visualization artistry without compromise. Its drag-and-drop interface lets analysts build intricate, interactive dashboards that genuinely impress stakeholders. You'll spend more money and implementation time, but you get unmatched flexibility for complex analytics. Tableau leads in data visualization with its intuitive interface for creating complex, interactive dashboards. The trade-off is real: Tableau isn't the fastest path to basic reporting, and its governance model can feel loose for enterprise deployments managing thousands of users.
Looker takes the opposite approach to governance. Built cloud-native with SQL at its core, Looker enforces data consistency through a semantic layer that prevents analysts from creating conflicting metrics. This makes it exceptional for scaled enterprises where data integrity matters more than speed-to-insight. You'll sacrifice some visualization polish and face a steeper learning curve, but you gain institutional control that Power BI and Tableau struggle to provide.
Qlik Sense brings associative analytics to the table, letting users explore data through intuitive associations rather than predefined queries. This approach shines for exploratory analysis and discovery work. However, the learning curve intimidates many teams, and its user base is significantly smaller than the market leaders, meaning fewer community resources and integrations.
Emerging platforms like ThoughtSpot excel at natural language queries, Sisense targets mid-market companies needing embedded analytics, and Zoho Analytics serves cost-conscious teams already in the Zoho ecosystem. Each solves a specific problem brilliantly while remaining niche.
The honest truth: your organization probably doesn't need the "best" tool. You need the right tool for your existing tech stack, budget constraints, and team skill levels. A startup with 10 analysts has completely different needs than a Fortune 500 company with 500. Evaluate based on your actual situation, not industry hype.
Pricing and Total Cost of Ownership
The sticker price of a BI platform tells only half the story. Power BI Pro starts at $14 per user monthly, while Tableau ranges from $15 to $115 per month depending on features, and enterprise platforms like ThoughtSpot and Looker average $100K-$150K annually. But licensing is just the beginning.
Real total cost of ownership includes cloud infrastructure, data warehouse connectivity, implementation services, and ongoing training. A platform requiring extensive analyst time for manual data investigation can cost more than a pricier solution with built-in automation, even if the upfront bill looks smaller. You're essentially choosing between paying the vendor or paying your team.
SaaS platforms do offer an advantage here: the vendor handles updates, security patches, and infrastructure maintenance, freeing your IT team to focus on strategy rather than firefighting. That's worth factoring into your budget comparison.
When building your business case, don't just calculate licensing fees. Map out implementation timelines, training costs, and the number of analysts you'll need. Then estimate the revenue impact: faster decision-making, reduced time spent on data hunting, and better visibility into customer behavior. A platform that helps your sales team close deals 10% faster or your marketing team optimize campaigns more quickly justifies premium pricing quickly.
Start with a realistic budget that accounts for the full picture, then evaluate platforms within that range. A cheaper tool that leaves your team frustrated and underutilized isn't a bargain. Conversely, the most expensive platform won't drive revenue growth if adoption stalls due to complexity or poor training. The sweet spot is finding the platform that balances cost with the outcomes your business actually needs.
The Rise of AI-Powered BI and Automated Insights
The business intelligence platform of 2026 doesn't just show you what happened. It tells you why it happened, what's about to happen, and what you should do about it.
We're moving from static dashboards to autonomous insight engines. Traditional BI platforms require analysts to spot anomalies, investigate root causes, and recommend actions. That's reactive work that delays decision-making. Modern platforms are shifting toward AI agents that monitor your KPIs around the clock, detect deviations automatically, and surface the most critical insights without waiting for someone to log in.
This means natural language queries, anomaly detection that learns your business baseline, and root cause analysis that connects dots across datasets. Some platforms even trigger automated actions, escalate alerts to the right team, or recommend next steps based on historical patterns. That's genuinely different from adding a chatbot to your dashboard.
Here's the reality check: most BI vendors claim AI capabilities now. Many offer basic natural language search or canned anomaly detection. Real agentic BI, the kind that operates with genuine autonomy and business context, remains rare and typically reserved for enterprise tiers.
The impact matters though. Organizations deploying true AI-powered BI reduce analyst time spent on routine investigations, accelerate decision cycles from days to hours, and shift from reactive firefighting to proactive strategy. Gartner predicts that 40% of enterprise applications will integrate task-specific AI agents by end of 2026, up from less than 5% in 2025.
When evaluating platforms, ask specifically about agentic capabilities, not just AI features. The depth of autonomous insight generation will increasingly separate the platforms that drive revenue growth from those that simply fill reporting backlogs.
How to Choose the Right BI Platform for Your Business
Choosing a BI platform isn't about finding the fanciest dashboard tool; it's about solving your actual business problems within your existing infrastructure. Start by mapping your technical ecosystem. Are you already invested in Microsoft products? Google Cloud? Running hybrid or on-premises systems? Your platform choice should integrate seamlessly with what you've already built, not force you into a migration project before you've gained any value.
Next, get specific about use cases. Executive dashboards have different requirements than real-time operational monitoring or exploratory data analysis. Some teams need embedded analytics in customer-facing applications; others just want self-service reporting. Each use case pulls toward different tools, so clarity here saves you from buying something overpowered or underpowered for your needs.
Honestly assess your team's technical depth. A powerful platform means nothing if your analysts spend weeks writing SQL queries instead of answering business questions. Consider whether you need self-service capabilities for business users or if you have the data engineering capacity for deeper customization. Training requirements matter too; factor in both time and cost.
Scalability deserves real thought, not hypotheticals. How many concurrent users today? What's your data volume, and how fast is it growing? A platform that works beautifully for 20 power users might choke at 200 casual users. Ask vendors for concrete limits and pricing models at your projected scale, not just your current footprint.
Calculate total cost beyond licensing. Implementation, infrastructure, ongoing support, and training often exceed software costs. Get fixed-price proposals where possible and understand what happens in year two when implementation is done.
Finally, run a pilot. Most vendors offer trials; use them with real data and real users, not toy examples. Watch for red flags: vendors who oversell capabilities, integrations that don't actually exist, or support teams that disappear after the sale closes. The right platform feels like it was built for your specific workflow, not something you're forcing into place.
The Missing Piece: From Insights to Action
Here's the uncomfortable truth: most business intelligence platforms are built for looking, not doing. You get beautiful dashboards, detailed reports, and real-time metrics. Then what? A team member notices something important, sends a Slack message, schedules a meeting, and by the time action happens, the moment has passed.
For ecommerce and SaaS companies, this lag is expensive. A high-value customer shows churn signals in your dashboard. A product page converts at half the expected rate. Cart abandonment spikes during peak hours. These insights sit on screens while revenue walks out the door. Organizations winning in 2026 aren't those with the most sophisticated BI tools, but those that most effectively turn data into action.
The gap between insight and action is where traditional BI platforms fall short. They excel at answering "what happened?" but struggle with "what happens next?" In fast-moving customer journeys, manual response is simply too slow. By the time someone manually triggers an email campaign or adjusts pricing, the customer has already left.
The evolution is clear: BI platforms that survive 2026 won't just visualize data. They'll automatically execute actions based on what that data reveals. Detect a churn risk, trigger a personalized retention offer in minutes. Spot a conversion bottleneck, automatically test variations. The real advantage comes when insights move from dashboards to action.
This shift from passive reporting to active response separates the tools that merely inform from those that actually drive revenue growth.
Frequently Asked Questions About BI Platforms
How long does implementation actually take?
Implementation timelines vary widely depending on your situation. A basic deployment with pre-existing clean data can happen in days to weeks, while complex enterprise rollouts across multiple departments and data sources might stretch to several months. The honest answer: it depends less on the tool itself and more on your data readiness, team capacity, and how many stakeholders need to sign off on decisions.
Do we really need a data warehouse?
Not necessarily. Modern business intelligence platforms are flexible about where your data lives. Some work beautifully with cloud databases, APIs, and even spreadsheets. That said, if you're pulling from dozens of fragmented sources, a data warehouse or data lake does make life easier by consolidating everything into one organized place. Think of it as optional infrastructure that becomes increasingly valuable as your data complexity grows.
What about security and compliance?
This is where you can breathe easy. All major platforms offer encryption, role-based access controls, and audit trails to track who accessed what and when. If you operate in regulated industries (healthcare, finance), verify that your chosen platform supports your specific compliance requirements. GDPR, HIPAA, SOC 2: the leading platforms handle these. Just confirm during your evaluation rather than assuming.
Can average employees actually build their own reports?
Yes, genuinely. Self-service BI is now standard, not experimental. Non-technical users can drag fields, create visualizations, and answer their own questions without waiting for the analytics team. That said, adoption jumps significantly when you invest in training. People need to understand what data means and how to avoid drawing wrong conclusions. Thirty minutes of guidance beats months of frustration.
How do we measure ROI?
Track concrete metrics: time saved on manual reporting, speed of decision-making cycles, and revenue lifted from insights that wouldn't have surfaced otherwise. A sales team that closes deals faster because they spotted trends earlier has measurable ROI. A marketing department that reduced campaign setup time by 40% has ROI. Look for these operational improvements first; they're easier to quantify than abstract "better decisions."
Why do BI projects actually fail?
The biggest culprit isn't the platform; it's choosing the tool before defining what problems you're solving. Many organizations benefit from working with experienced implementation partners who guide both technical setup and user adoption. Poor data quality and weak change management also derail projects. Start with clarity on business needs, invest in data preparation, and plan for people adoption from day one.
Key Takeaways: Choosing and Implementing BI in 2026
Here's what separates successful BI implementations from the 73% that stumble: intention and preparation. You need three things working in concert: the right platform for your tech stack, genuinely clean data flowing into it, and an organization willing to act on what it reveals.
Platform selection isn't about feature checklists. It's about fit. If you're already deep in Microsoft's ecosystem, Power BI delivers fast ROI at lower cost. If visualization sophistication drives your decisions, Tableau remains unmatched. Need ironclad governance across a sprawling organization? Looker handles that better than most. The platform matters less than whether it connects to your existing infrastructure without friction.
Budget realistically. Licensing fees are only the beginning. Implementation, data engineering, training, and ongoing infrastructure typically cost 2 to 3 times the software license itself. Organizations that underestimate this invariably cut corners on data quality or adoption, then blame the platform.
AI and automation aren't nice-to-haves anymore; they're baseline expectations. Platforms without genuine agentic capabilities, where AI actually recommends actions rather than just highlighting anomalies, will feel outdated within months.
The real opportunity lies beyond dashboards. Static reports don't drive revenue. Automated workflows that trigger decisions, alert the right people, and execute actions do. That's where your ROI compounds.
Finally, remember that technology is maybe 40% of the equation. The rest depends on whether your team trusts the data, understands how to use it, and has permission to act on it. Success requires cultural commitment as much as technical capability. Start there.
Beyond Dashboards: How Arktis Completes Your BI Stack
Here's the honest truth: your BI platform is doing exactly what it was built to do. It's showing you what happened. Sales dropped 12% last week. Customer acquisition cost climbed. Churn spiked in your enterprise segment. Those dashboards are accurate, detailed, and completely necessary.
But they stop there.
The gap between knowing a problem exists and actually fixing it is where most companies lose revenue. A marketer sees that conversion rates fell but lacks the context to act. A product team spots a retention issue but can't automatically trigger recovery workflows. Leadership understands the numbers but struggles to connect data to real business outcomes.
This is where conversion-focused analytics becomes critical for ecommerce and SaaS teams specifically. You need a system that doesn't just report what happened; it identifies why it happened and what to do about it. One that tracks complete customer journeys in a privacy-first way, meaning you understand conversion drivers without exposing customer data. One that uses AI to surface hidden growth opportunities and revenue recovery moments automatically.

The most effective teams aren't choosing between traditional BI and conversion intelligence. They're building both. Your BI platform remains the source of truth for historical performance and strategic reporting. But layering in analytics that automatically trigger workflows, detect opportunities, and close the insight-action gap is what actually moves the needle on revenue.
That 10% uplift? It comes from acting on insights faster than your competitors, not from having better dashboards.
Go deeper in the Learning Hub
Try Arktis free for 7 days
Attribution tracking, session recordings, and AI automation in one platform. Set up in 2 minutes, free for 7 days.
Start 7-day free trial