
Confidence Interval: A Detailed Explanation for 2026
Last Updated: March 19, 2026 Key Takeaways A confidence interval is a range of values estimated from sample data that likely contains the true population parame...

Last Updated: March 19, 2026
Key Takeaways
- A confidence interval is a range of values estimated from sample data that likely contains the true population parameter
- A 95% confidence interval means if you repeated sampling 100 times, 95 would contain the true value
- Confidence intervals quantify uncertainty, essential for A/B testing, conversions, and data-driven decisions
- Narrower intervals indicate more precision, wider intervals indicate more uncertainty in your estimates
- Understanding confidence intervals prevents costly business decisions based on unreliable sample data
What is a Confidence Interval?
A confidence interval is a range of values, calculated from your sample data, that likely contains the true answer you're looking for. Rather than saying "our conversion rate is 12 percent," you'd say "we're 95 percent confident the true conversion rate falls between 10 and 14 percent." That range is your confidence interval.
Here's why this matters: you can't measure every single customer, visitor, or transaction. You work with samples. And here's the problem with samples: they vary. If you survey 100 customers today and 100 different customers tomorrow, you'll get slightly different results each time. A confidence interval quantifies that natural variation, giving you a realistic band rather than a false sense of precision.
This distinction transforms how you make decisions. Instead of betting the farm on a single estimate, you acknowledge the range of plausible outcomes. Marketing budgets, product launches, staffing decisions, all benefit from this honest framing. You're not being wishy-washy; you're being realistic about what your data actually tells you. According to research, confidence intervals bridge the gap between data variability and the precision businesses need. That bridge is essential when stakes are high and uncertainty is real.
Understanding 95% Confidence: What It Really Means
Here's where most people hit a mental wall, and honestly, even experienced analysts struggle with this concept. When someone says "95% confidence interval," your brain probably jumps to this conclusion: "There's a 95% chance the true value sits inside this interval." That's intuitive. That's also wrong.
The real meaning is more subtle but far more useful once you grasp it. A 95% confidence interval refers to the reliability of your method, not the probability of any single interval. Think of it this way: if you repeated your entire sampling procedure 100 times from the same population, approximately 95 of those resulting intervals would capture the true value. The other five would miss it. According to Wikipedia's explanation, "If the same sampling procedure were repeated 100 times from the same population, approximately 95 of the resulting intervals would be expected to contain the true population mean."
This is a long-run frequency statement. Once you've calculated your specific interval, the true value is either inside it or it isn't. There's no probability involved anymore; it's binary. You don't get to say "95% chance" about that particular interval. You can only say your method works 95% of the time across repeated samples.
Why does this distinction matter for your decisions? Because it prevents overconfidence. That single interval you're looking at right now might be one of the lucky 95, or it might be one of the unlucky five. You won't know. This is why pairing your confidence interval with other evidence, context, and assumptions strengthens your analysis.
Different confidence levels offer different trade-offs. A 90% interval is narrower but less reliable; 99% is wider but more stringent. According to business research, "A common acceptable confidence interval to management is 95%, meaning 19 out of 20 samples will give results that are representative of the overall population." Most organizations default to 95% because it balances precision with practicality, though your choice should depend on the stakes of your decision.
How Confidence Intervals Work: The Core Components
A confidence interval breaks down into four essential components that work together to define your range of likely values. Understanding each piece helps you interpret results correctly and make decisions with appropriate caution.
The point estimate is your sample statistic. If you surveyed 500 customers and found a 5% conversion rate, that 5% is your point estimate. It's your best single guess based on the data you collected. But here's the catch: if you ran the survey again with a different sample of 500 customers, you'd likely get a slightly different result. That's where the other components come in.
The margin of error is the plus-or-minus range around your point estimate. It answers the practical question: "How far off might I be?" A margin of error of 2% means your true conversion rate probably falls somewhere between 3% and 7%. This range isn't arbitrary; it's calculated using the standard error, which measures how much your sample estimates would vary if you repeated the study multiple times.
Your confidence level is how certain you want to be. A 95% confidence level means if you repeated your study 100 times, roughly 95 of those intervals would contain the true value. Higher confidence levels (like 99%) feel safer but come with a trade-off: they create wider intervals, which are less precise.
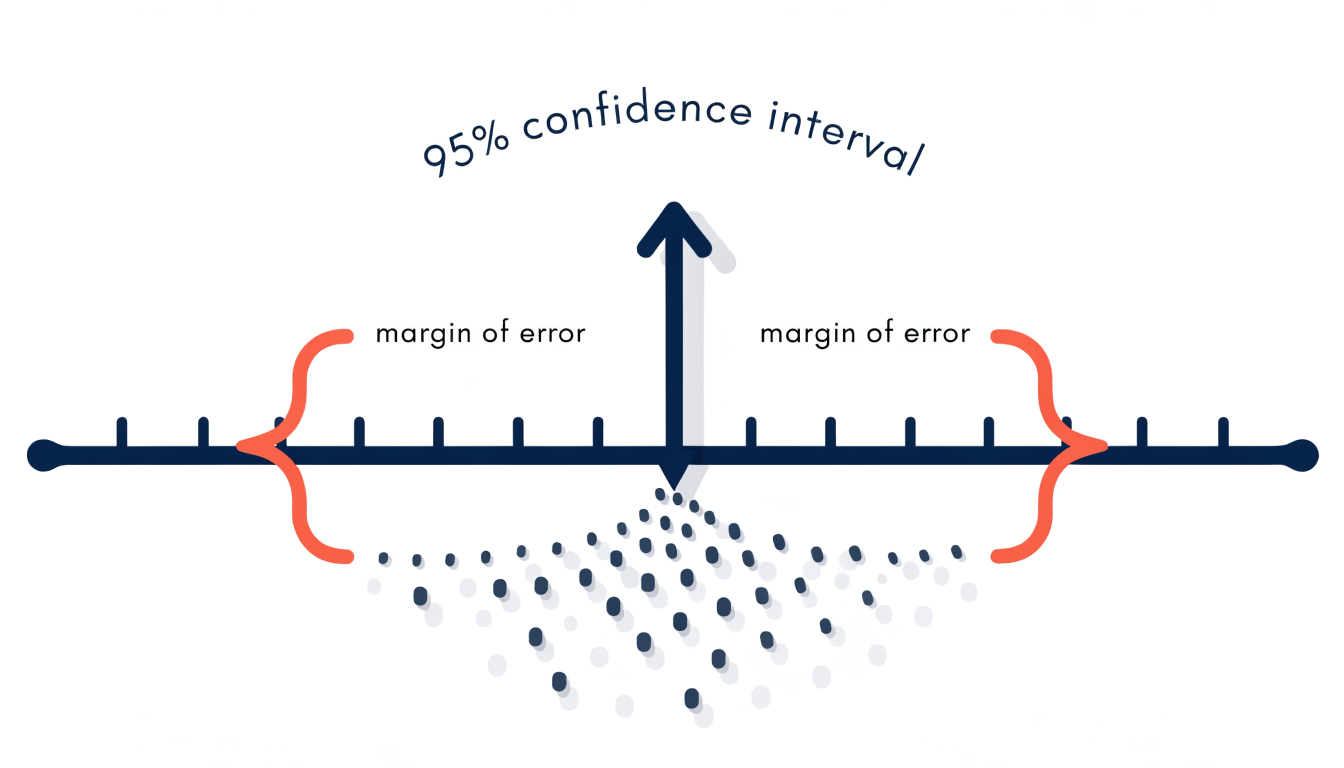
Sample size directly controls your margin of error. Generally, the larger the number of measurements made, the smaller the standard error and narrower the resulting confidence intervals. Doubling your sample size doesn't halve your margin of error, but it does meaningfully tighten it. This relationship is why market researchers obsess over sample sizes; bigger samples deliver more reliable, precise intervals that actually guide decisions.
Confidence Intervals in Business: A/B Testing and Conversion Rate Optimization
Here's where confidence intervals transform from abstract statistics into concrete business value. When you run an A/B test on your ecommerce checkout flow or test a new SaaS onboarding experience, you're not just looking for any difference between variants. You need to know whether the difference you observe is real or just random noise. Confidence intervals help determine whether the difference in performance between two variants is statistically significant in A/B tests, giving you the statistical backbone to make confident decisions.
Consider a practical example: your current landing page converts at 5%. You test a redesigned version and see 5.3% conversions. Sounds like a win, right? Not necessarily. Instead of reporting just the point estimate, confidence intervals tell the real story. Your original rate might be 4.8% to 5.2% with 95% confidence, while the new version lands at 5.0% to 5.6%. These ranges overlap, meaning the improvement might not be real yet. You need more data before scaling the change.
Narrow confidence intervals equal confidence in your estimates; wide intervals signal uncertainty. When your interval is tight, you've gathered enough evidence to act decisively. When it's wide, you need either more traffic, more time, or both.
The business applications extend far beyond conversion rates. Marketing teams use confidence intervals to estimate lead conversion rates and predict customer lifetime value with precision. Rather than saying "our customers are worth $5,000," you can confidently claim "between $4,800 and $5,200 at 95% confidence." This precision matters when making budget allocation decisions or justifying marketing spend.
Confidence intervals are widely used in marketing to estimate lead conversion and customer lifetime value. The key principle remains consistent: if your confidence interval for a difference includes zero, the effect likely doesn't exist. That redesign, feature update, or campaign variation might not deliver the revenue lift you're hoping for. By grounding decisions in confidence intervals rather than hunches or single data points, you systematically reduce costly mistakes and identify genuine growth opportunities.
Common Misconceptions and How to Avoid Them
If you've worked with data long enough, you've probably heard someone say, "This 95% confidence interval means there's a 95% probability the true value is in this range." It sounds intuitive, but it's actually backwards. A 95% confidence interval does not mean 95% of the sample data lie within that interval; rather it is an interval estimate of plausible values for the population parameter. The correct interpretation: if you repeated your study 100 times, roughly 95 of those intervals would contain the true population value. The true value either is or isn't in your specific interval; probability doesn't apply to it once it's fixed.
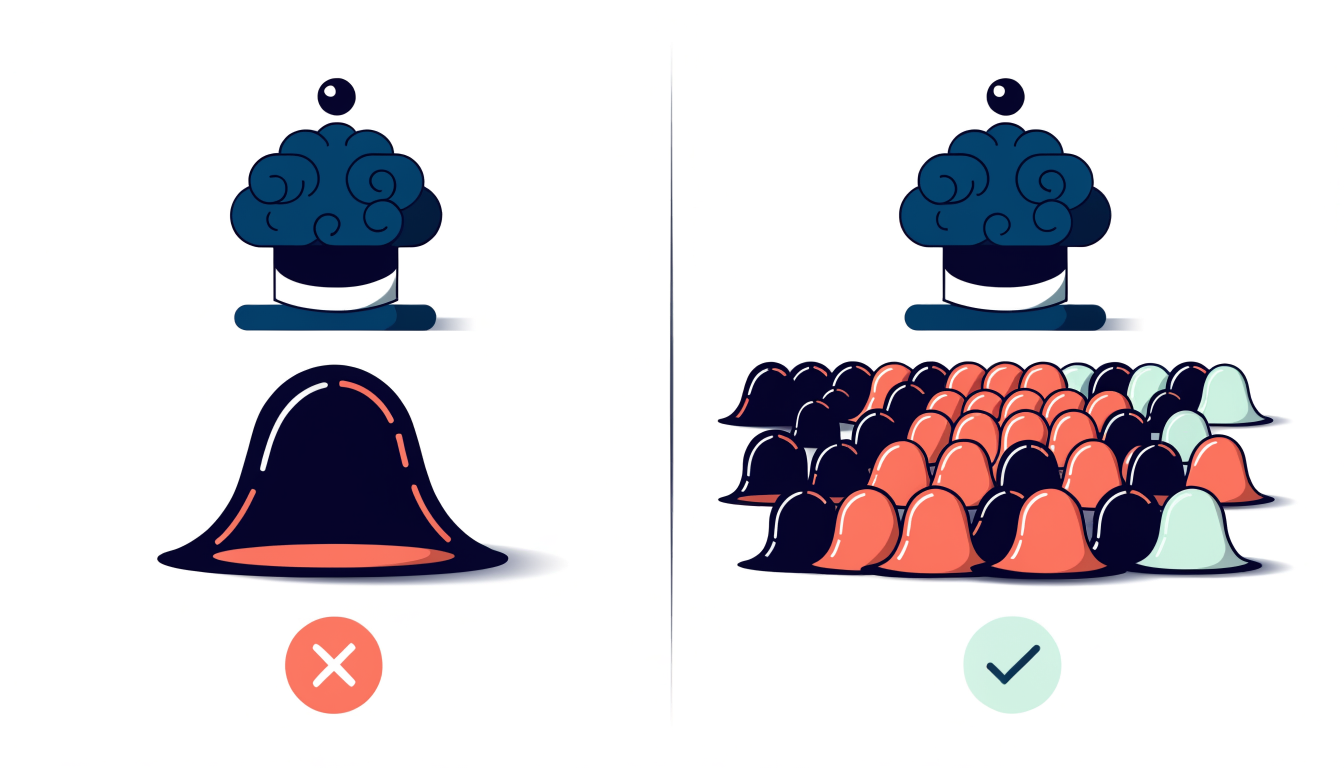
Another common trap: assuming all values within your interval are equally likely. They're not. Values near the center carry more statistical weight than those at the edges. This matters when you're making decisions based on the interval's range.
Two more quick ones to watch for: thinking the interval describes your sample rather than the population parameter, and assuming overlapping confidence intervals automatically mean no meaningful difference exists. Overlap doesn't tell the whole story; you need proper hypothesis testing.
The fix is straightforward: anchor yourself to the long-run frequency interpretation. You're estimating a population characteristic, not assigning probabilities to individual intervals. Once you make that mental shift, everything else clicks into place.
Calculating and Interpreting Confidence Intervals for Your Data
At its core, calculating a confidence interval follows a straightforward formula: Point Estimate ± (Critical Value × Standard Error). The point estimate is your sample result, the critical value depends on your confidence level (typically 95%), and the standard error reflects your sample's variability. You don't need to memorize the math; most tools handle it automatically. What matters is understanding what the numbers tell you.
The width of your interval reveals everything about reliability. A narrow interval suggests your estimate is stable and trustworthy. A wide interval signals uncertainty, meaning you'd benefit from more data. This is where sample size becomes your most powerful lever. To halve the margin of error at a given confidence level, quadruple the sample size. It's not a linear relationship; you need substantially more data for modest improvements in precision.
Here's the practical tension: larger samples deliver narrower intervals but demand more time and budget. Your job is finding the sweet spot between confidence and resources.
Interpreting your results matters more than calculating them. When you say you're 95% confident that customer satisfaction falls between 72% and 78%, you're claiming that if you repeated your survey many times, roughly 95% of those intervals would capture the true population value. Businesses use confidence intervals to determine the likelihood that data drawn using sampling is representative of the overall population. Apply this to conversion rates, revenue forecasts, and survey results. A narrow interval around your key metrics gives you the confidence to make decisive moves.
Key Takeaways: Using Confidence Intervals to Drive Better Decisions
Confidence intervals transform how you make decisions with data. Instead of betting on a single number, you're working with a realistic range that acknowledges what you don't know. This shift from false certainty to honest uncertainty is what separates businesses that stumble from those that scale.
The 95% confidence standard exists for good reason. It balances precision with practicality, giving you enough statistical rigor without requiring infinite data. When your interval is wide, that's not a failure; it's valuable information telling you to collect more data before committing resources to a major decision.
Apply confidence intervals everywhere sample data matters: A/B tests on your website, customer surveys, revenue forecasts, market research. When communicating results to stakeholders, always report the range, not just the point estimate. "We expect 8-12% conversion improvement" beats "We expect 10% improvement" because it shows you understand the real world is messy.
This framework isn't just statistically sound; it's competitive advantage. Teams that quantify uncertainty make faster, bolder decisions because they know exactly what they're risking.
Conclusion: Confidence Intervals as Your Competitive Edge
The companies winning in 2026 aren't those with the most data. They're the ones who understand what their data actually means. Confidence intervals separate the organizations making informed bets from those simply guessing at scale.
Think about your last major decision: a product launch, a marketing pivot, a pricing change. Did you act on a single number, or did you consider the range of possibilities? That's the difference confidence intervals create. Every conversion estimate, A/B test result, and forecast you rely on should come with a clear picture of its uncertainty. This isn't academic rigor for its own sake; it's practical protection against costly mistakes.
The landscape is shifting fast. As data analytics continues to evolve, confidence intervals will remain an essential tool for interpreting and acting on data insights, according to industry experts. But the real edge comes from combining this statistical thinking with automation and AI that surfaces insights in real time, letting you act on uncertainty before competitors even recognize it exists.
Your competitive advantage isn't hiding from uncertainty. It's quantifying it, understanding it, and building it into every decision you make. When you know the true range of outcomes, you can set realistic targets, allocate resources smarter, and pivot faster when reality diverges from expectations.
The tools exist now to make this happen. Start small: pick one critical metric, establish its confidence interval, and watch how that single shift in perspective changes your decision-making. That's how data-driven confidence becomes your business's defining edge.
Go deeper in the Learning Hub
Try Arktis free for 7 days
Attribution tracking, session recordings, and AI automation in one platform. Set up in 2 minutes, free for 7 days.
Start 7-day free trial