
Ultimate Guide to Ecommerce Conversion Rate Optimization 2026
Last Updated: March 2, 2026 Quick Summary Average ecommerce conversion rate is 1.65-2% globally; top performers hit 4%+ through systematic optimization Cart aba...

Last Updated: March 2, 2026
Quick Summary
- Average ecommerce conversion rate is 1.65-2% globally; top performers hit 4%+ through systematic optimization
- Cart abandonment at 70% reveals friction points in checkout, shipping costs, and trust signals
- Mobile optimization is critical: 72% of ecommerce sales come from mobile but conversion rates lag desktop
- Conversion path analysis reveals which touchpoints drive revenue; 2-5 touchpoints typical for ecommerce
What Is Ecommerce Conversion Rate Optimization and Why It Matters
Your conversion rate is simple: the percentage of visitors who complete a desired action, whether that's making a purchase, signing up, or downloading a resource. But here's what matters more: conversion rate optimization (CRO) is the systematic process of removing friction from that journey to increase that percentage.
This distinction is critical. Your conversion rate is a metric; CRO is a methodology. And right now, it's your most underutilized revenue lever.
Consider this: a 1% increase in conversion rate on a $10 million revenue site adds $100,000 instantly, without spending a dime on additional traffic or advertising. No paid search budget increase. No influencer partnerships. Just smarter optimization of the visitors already arriving at your site.
When customer acquisition costs are climbing and competition is fierce, this matters enormously. You can either spend more to attract new visitors, or spend strategically to convert the ones you have. The math heavily favors the latter.
CRO involves refining every aspect of your customer experience, from product descriptions and page load speed to checkout flows and post-purchase communication. It's not a one-time project or a lucky tweak that happens to work. It's a continuous cycle of testing, learning, and iterating based on actual user behavior.
The businesses winning in 2026 aren't just driving traffic. They're converting it efficiently. They're treating their website like the revenue-generating asset it is, not an afterthought.

Understanding Conversion Rate Benchmarks by Industry and Device
Here's the section:
Before you benchmark your performance, you need to know what "good" actually looks like for your specific business. The global average conversion rate sits at 1.65-2%, but this number is nearly useless without context. Your industry, product type, and traffic sources create vastly different conversion realities.
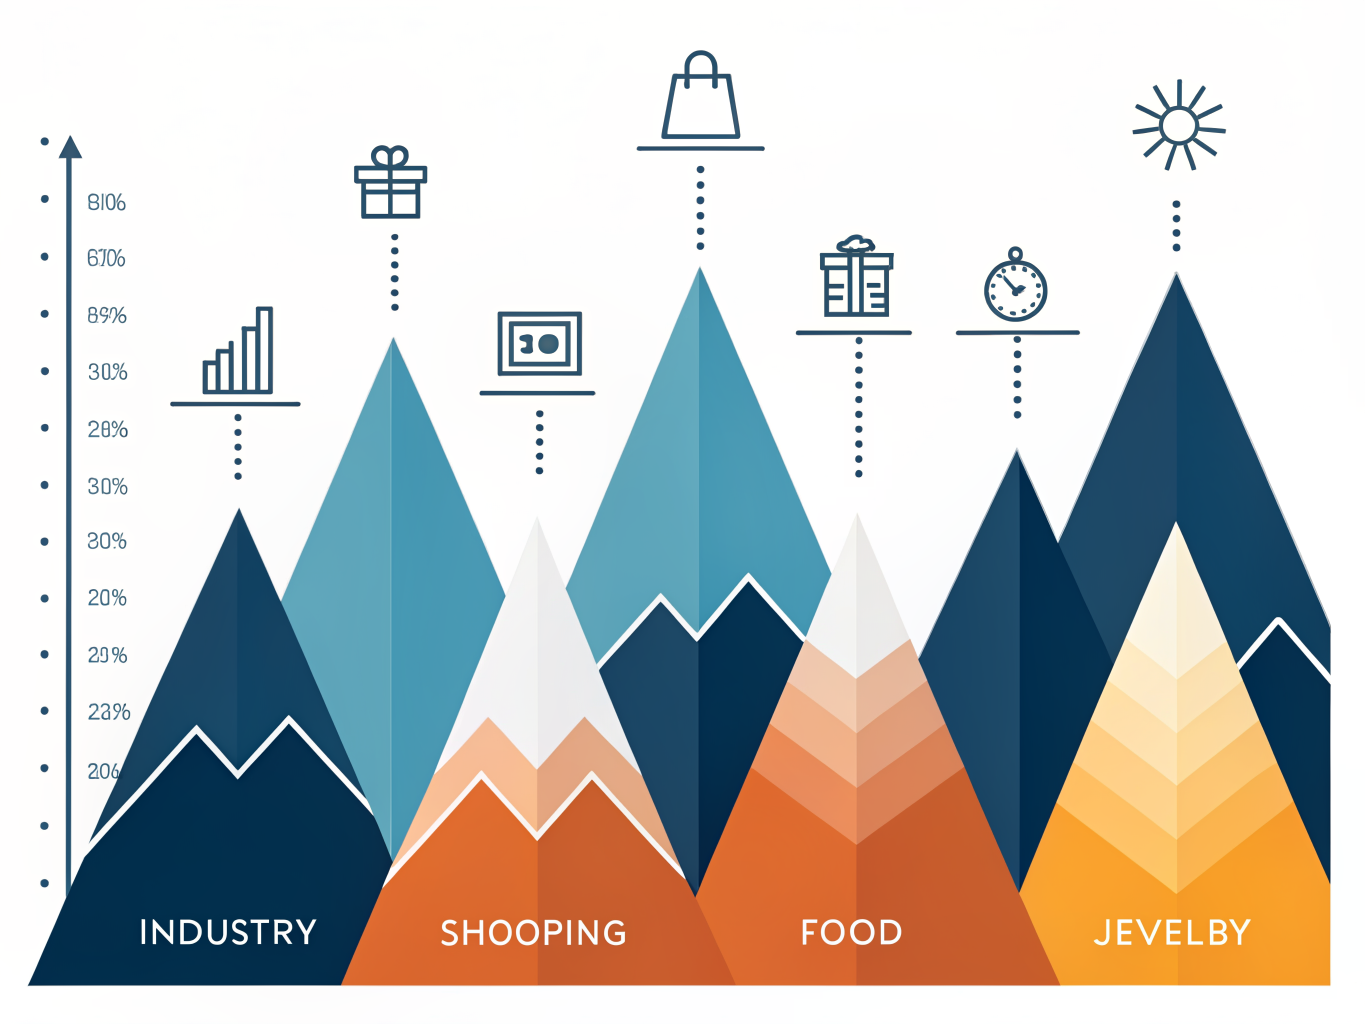
Consider Food and Beverage: it converts at 6.02%. Why? These purchases carry low perceived risk and often involve impulse decisions. A customer sees a snack they want and buys it immediately. Contrast this with luxury goods, which convert at just 1.19%. High-ticket items require extensive research, price comparison, and consideration cycles. Your benchmark shouldn't be 2%; it should be what similar businesses in your category actually achieve.
Device type matters just as much. Mobile represents 85.65% cart abandonment versus 73.76% on desktop, a significant gap driven by friction, smaller screens, and interrupted shopping sessions. If you're mobile-heavy, expect lower overall conversion rates unless you've specifically optimized for that friction.
Your traffic source also predicts conversion potential. Organic search converts at roughly 4%, while paid ads typically convert at 2-3%. This isn't random; organic visitors have already decided they want something and are searching for solutions. Paid traffic often includes early-stage browsers still evaluating options.
Find your industry, device mix, and traffic sources in these benchmarks. That's your actual starting line, not the global average. This clarity transforms optimization from guessing to strategy.
The Six Critical Friction Points Killing Your Conversions
Here's the reality: your visitors aren't abandoning carts because they don't want your products. They're leaving because something in their journey feels broken, expensive, or unsafe.
Let's diagnose the six friction points sabotaging your conversions.
Speed kills conversions faster than anything else. Conversions can fall by up to 20% for every one-second delay on mobile. Since mobile now accounts for 72% of all ecommerce sales, a sluggish mobile experience isn't a minor problem; it's revenue hemorrhaging in real time.
Checkout complexity triggers abandonment at scale. Long forms, unexpected fees, and mandatory account creation create friction at the moment of highest intent. When customers discover shipping costs or taxes in the final steps, many simply leave.
Missing trust signals create doubt precisely when you need confidence. Absent customer reviews, unclear return policies, or missing security badges signal risk to buyers. They'll head to a competitor who feels safer, even if your product is superior.
Mobile underperformance persists despite mobile dominance. While mobile will reach 88% of ecommerce sales by 2027, many sites still optimize for desktop first. Cramped layouts, tiny buttons, and mobile-unfriendly forms push conversions to desktop or to competitors.
Limited payment options exclude ready buyers. Not everyone carries a credit card or trusts PayPal. Missing digital wallets, buy-now-pay-later options, or local payment methods means losing customers at checkout.
Shipping cost shock causes cart abandonment. Global cart abandonment averages 70.19%, and late-revealed shipping costs are a primary culprit. Customers feel misled when surprise fees appear at the final step.
The good news: these aren't unsolvable problems. They're diagnostic indicators telling you exactly where to focus.
The next section breaks down how to systematically eliminate each one.
Seven Proven Strategies to Increase Ecommerce Conversion Rates
Here's the section:
Not all conversion optimizations are created equal. Some deliver massive results with minimal effort; others require substantial investment. The key is knowing which to prioritize and how to implement them effectively.
Start with Quick Wins
Social proof works because it removes friction from the buying decision. Products with 11-30 reviews convert approximately 68% higher than those with zero reviews. Your action: implement a review collection system immediately. Email customers post-purchase with a simple request and direct link. Aim for at least 20 reviews within 60 days.
Trust signals matter equally. Display security badges, money-back guarantees, and shipping information prominently. These cost nothing but significantly reduce purchase hesitation.
Medium-Effort, High-Impact Moves
Checkout complexity kills conversions. Reduce your checkout flow to three steps maximum: cart review, shipping/billing, payment confirmation. Enable guest checkout without forcing account creation. This single change typically lifts conversions by 10-15%.
Mobile optimization is no longer optional; it's survival. Ensure autofill functionality, enable mobile payment options like Apple Pay and Google Pay, and test your entire experience on actual devices. Slow mobile experiences hemorrhage sales.
Page speed directly impacts your bottom line. Aim for pages loading under three seconds; use a CDN and compress images aggressively. Every additional second of load time costs conversions.
Abandoned cart recovery captures revenue you've already earned. Send emails within one hour of cart abandonment with a gentle reminder and a modest incentive (5-10% off). This single tactic typically recovers 10-20% of abandoned orders.
Advanced Tactics Worth Your Time
Personalized messaging drives 21% more conversions. Use customer data to show relevant product recommendations and tailored copy based on browsing behavior.
AI chatbots achieve 20%+ conversion increases while reducing support costs. Deploy one to answer questions in real-time, especially during peak shopping hours.
The critical principle: test everything. Start with high-impact, low-effort tactics, then systematically move up the effort scale. Your conversion rate isn't fixed; it's a dial you control.
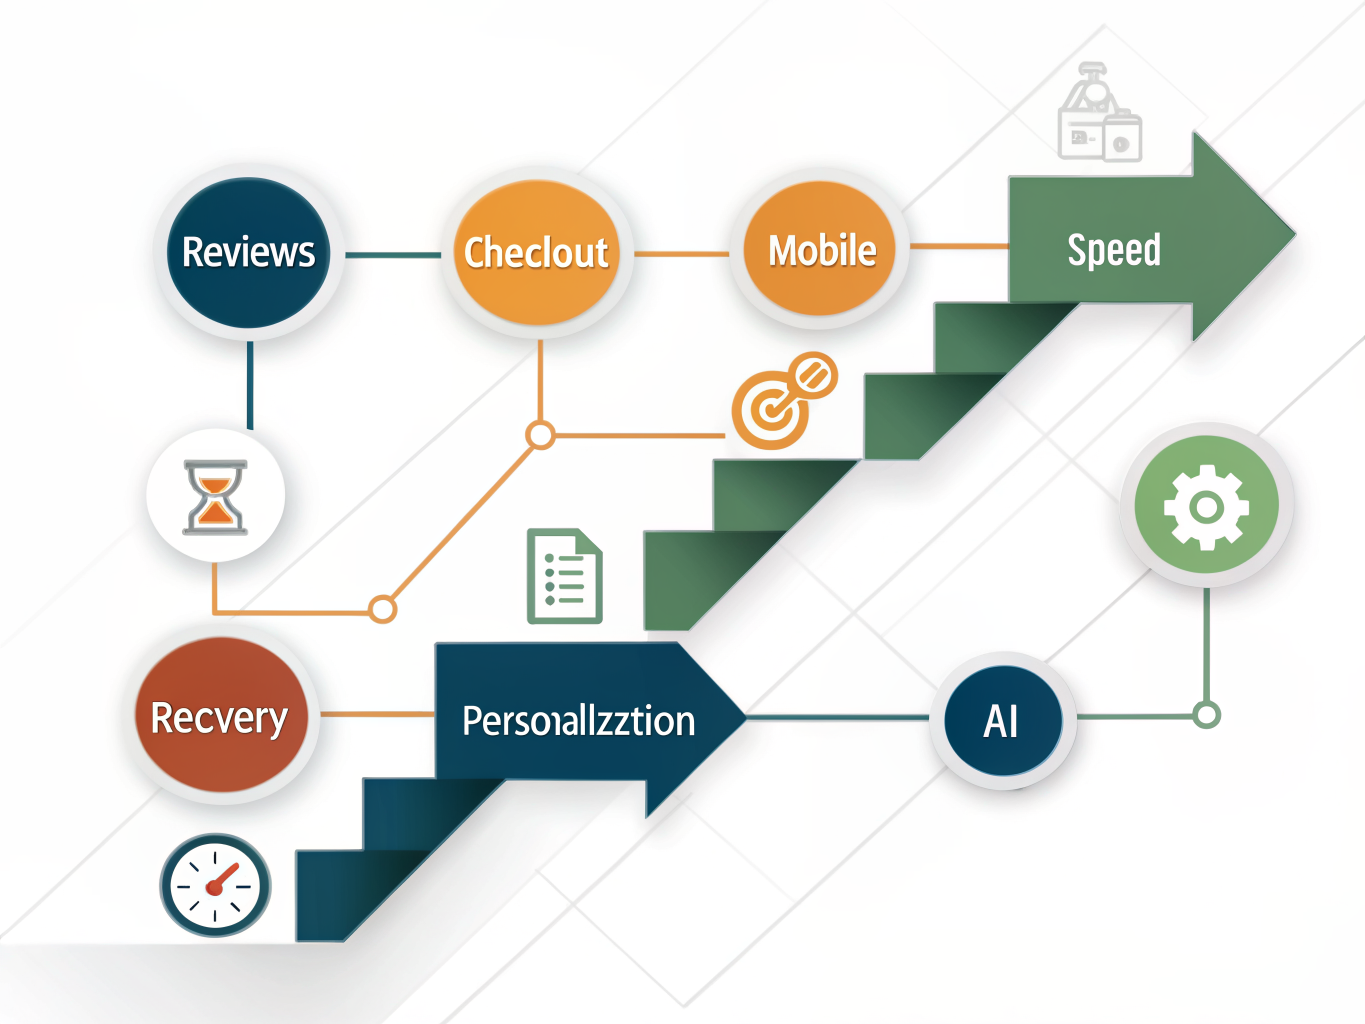
Mastering Conversion Path Analysis to Find Revenue Leaks
Your customers don't convert on their first visit. Most ecommerce businesses see 2-5 touchpoints before a purchase happens, which means understanding the full journey matters more than obsessing over any single channel.
Conversion path analysis maps every interaction a customer has with your brand before they buy. It reveals which touchpoints actually move people forward and which ones waste your budget. Here's what makes this powerful: organic search might bring someone to your site initially, but retargeting ads close the deal. If you only credit the last click, you'll starve your awareness channels and eventually kill future conversions.
Start by segmenting your paths by traffic source and device. A customer who browses on mobile but converts on desktop follows a different journey than someone who stays on one device. Product category matters too. High-intent buyers searching for a specific item take shorter paths than those discovering you through social media.
The real revenue leak appears when you spot where people drop off. If 40% of visitors leave after viewing your product page, that's your bottleneck. If they abandon after adding to cart, your checkout flow needs attention.
To begin analyzing paths in Google Analytics, set up conversion goals by channel and examine the "Paths" report under Conversions. Look for patterns: which combinations of channels drive your highest-value customers? Which channels play supporting roles versus closing roles?
Most teams skip this step because it feels complicated. It's not. You're simply answering one question: what's the actual route your best customers take? Once you know that, optimization becomes obvious.
Building Your CRO Testing Framework: From Hypothesis to Results
The difference between random testing and systematic testing is the difference between hoping for results and actually getting them. Start by forming a hypothesis based on real data, not intuition. Use heatmaps and session recordings to watch how visitors actually behave on your site, then ask yourself: what's preventing conversions? Maybe your product images lack detail. Maybe your checkout button blends into the background. Maybe your headline doesn't match what visitors searched for.
Once you've identified a problem, test one element at a time. Change your headline while keeping everything else constant. Test a new CTA button color. Adjust product page layout. This isolation matters because if you change five things simultaneously, you won't know which one actually moved the needle.
Here's where patience becomes critical: you need at least 1,000 conversions per test variant to reach statistical significance. That sounds like a lot, but it's what separates real wins from statistical noise. Declaring a winner too early is a common mistake that leads to implementing changes that actually hurt long-term performance.
Start with your highest-traffic pages. A 1% improvement on your homepage or product pages generates far more revenue than the same improvement on a lower-traffic page. This is leverage in its purest form.
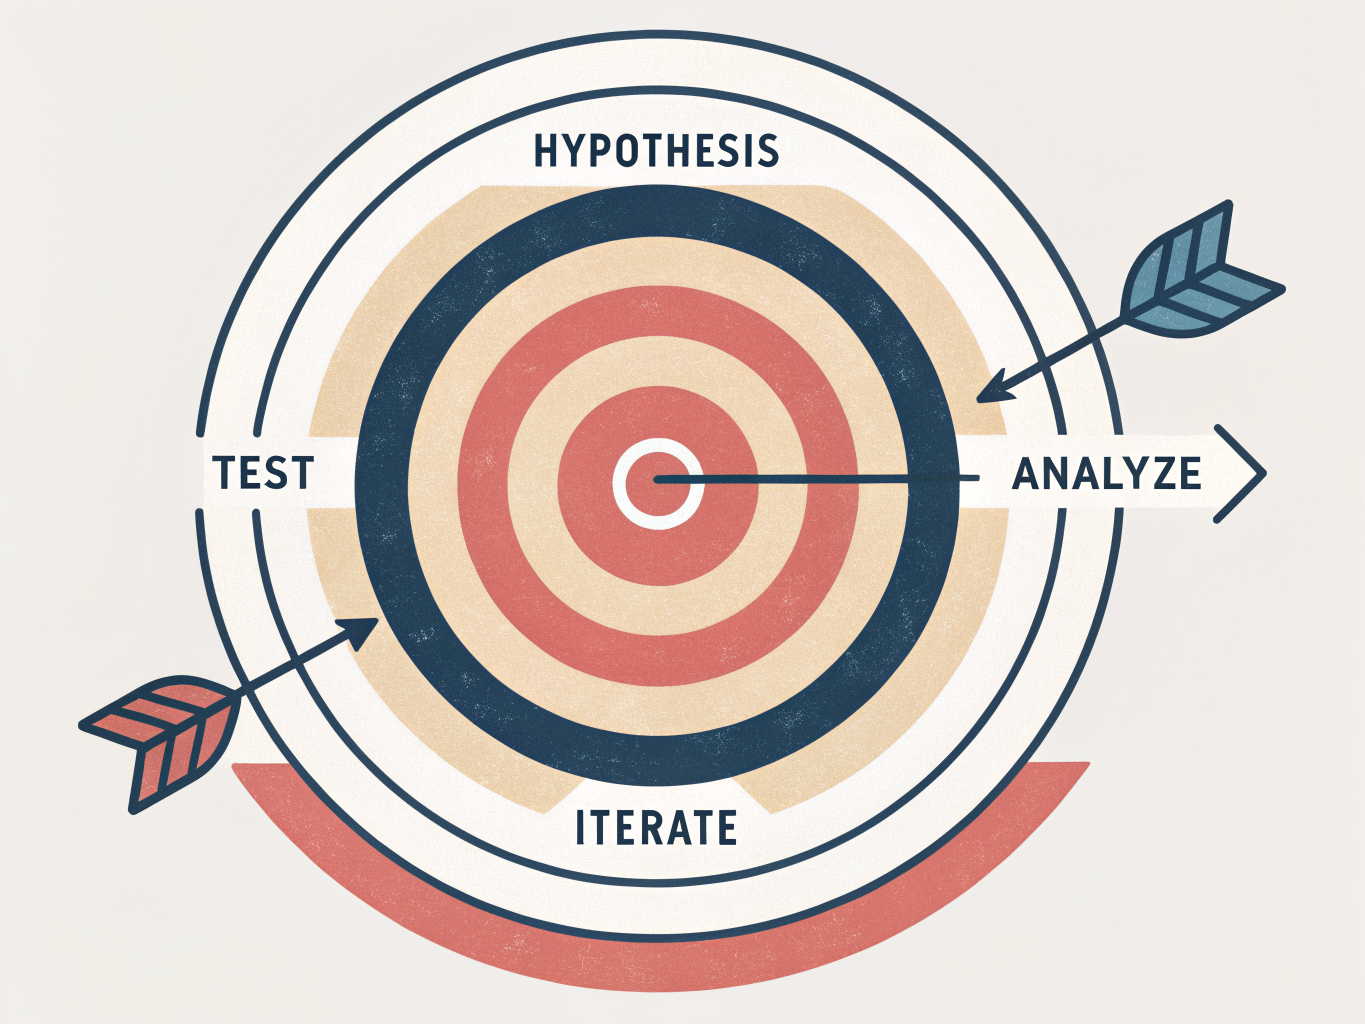
Remember this: CRO isn't a one-time fix; it's an ongoing process where you adapt to new technologies and consumer preferences. Set up a testing roadmap for the next quarter. Prioritize pages by traffic volume and conversion potential. Run tests sequentially, not in parallel, so you can isolate results clearly. Document everything. Build institutional knowledge. Each test teaches you something about your specific audience, not about ecommerce in general.
Key Takeaways: Your Conversion Optimization Action Plan
Here's your action plan. Start this week.
Quick Wins (Days 1-7) Pull your current conversion rate and benchmark it against your industry standard. Then implement trust signals immediately: customer reviews, security badges, testimonials. These cost little, deploy fast, and work. Mobile optimization comes next. Since 72% of ecommerce sales happen on mobile, audit your checkout flow on phones right now. Fix any friction points that jump out.
Medium-Term (Weeks 2-4) Set up conversion path tracking in Google Analytics 4 to see exactly where customers drop off. Identify your top three friction points and prioritize by impact, not ease. Start A/B testing on high-traffic pages, particularly product pages and checkout steps. Run tests for two weeks minimum before declaring winners.
Long-Term (Months 2-3) Build a systematic testing calendar. Aim for a realistic 0.5-1% annual conversion rate improvement. Track revenue impact, not just percentage gains. A 0.3% lift on a million-dollar site matters.
The key: small improvements compound. One test might lift conversions 2%. Another adds 1.5%. Stack them together and you've fundamentally changed your business. Start with what you can control today, measure everything, and build from there.
Frequently Asked Questions About Ecommerce Conversion Optimization
Q: What's a good conversion rate for my ecommerce store?
There's no universal answer. A 2-4% conversion rate is typical across ecommerce, but this varies significantly by industry. Fashion and beauty sites often convert at 1-2%, while niche B2B ecommerce can hit 5-10%. The real benchmark is your own category and competitors. Pull data from your industry peers and set targets based on where you currently stand, not arbitrary numbers.
Q: How long until I see results from CRO?
Quick wins appear in 2-4 weeks. Removing friction points, improving page speed, or fixing obvious checkout issues yield fast returns. Meaningful, sustained improvements take 3-6 months of testing and iteration. The key is treating CRO as ongoing, not a one-time project.
Q: Should I prioritize mobile or desktop?
Mobile, without hesitation. Mobile accounts for roughly 72% of ecommerce traffic, yet conversion rates typically lag desktop by 20-30%. This gap represents your biggest opportunity. Optimize mobile checkout, reduce form fields, and ensure fast load times first.
Q: What tools do I need to start?
Google Analytics 4 is free and essential for baseline data. Hotjar or Microsoft Clarity show user behavior through heatmaps and session recordings. For A/B testing, Optimizely or VWO are industry standards, though many platforms offer built-in testing features. Start with analytics and heatmaps before investing in testing tools.
Q: How do I convince leadership to fund CRO?
Speak their language: revenue. A 1% conversion rate increase on a $10M annual site equals $100K in additional revenue, often with minimal incremental costs. Model this specifically for your business. Leadership funds what generates measurable returns.
Q: What's the difference between conversion rate and conversion path?
Conversion rate is the percentage of visitors who complete your goal. Conversion path is the specific journey they take to get there. Understanding both matters: your rate tells you if optimization is working; your path reveals where visitors drop off.
Conclusion: Start Your Conversion Optimization Journey Today
You've now seen the framework. You understand that conversion rate optimization isn't about chasing trends or copying what competitors do. It's about systematically removing friction, testing assumptions, and letting data guide every decision.
Here's what matters most: you don't need a perfect strategy to start winning. A 1% increase in conversion rate can significantly boost revenue without spending another dollar on ads. That's compounding growth built directly into your existing traffic.

Your next move is simple. Pick one high-traffic page. Identify the biggest friction point. Set up conversion tracking if you haven't already. Then run one focused test. Small experiments compound into real revenue.
CRO is a continuous practice, not a destination. The companies winning in 2026 aren't waiting for perfection. They're testing, learning, and improving every week. Your competitive advantage isn't in having all the answers; it's in asking better questions faster than anyone else.
Start today. The revenue potential is waiting.
Go deeper in the Learning Hub
Try Arktis free for 7 days
Attribution tracking, session recordings, and AI automation in one platform. Set up in 2 minutes, free for 7 days.
Start 7-day free trial