
Top SaaS Analytics Tools for Business Growth in 2026
Last Updated: March 4, 2026 Key Takeaways Amplitude and Mixpanel dominate product analytics with behavioral tracking, retention cohorts, and predictive insights...

Last Updated: March 4, 2026
Key Takeaways
- Amplitude and Mixpanel dominate product analytics with behavioral tracking, retention cohorts, and predictive insights
- ChartMogul and Baremetrics specialize in revenue metrics like MRR, churn, and LTV with Stripe integration
- PostHog and Heap offer cost-effective alternatives with free tiers supporting 1M+ events monthly
- AI-powered churn prediction now accessible to all SaaS sizes, reducing churn by 15-20% when implemented correctly
- Fragmented analytics waste 40% of marketing budgets; revenue-first stacks deliver up to 650% ROI improvement
Why SaaS Analytics Tools Matter More Than Ever in 2026
Here's the section:
Your SaaS company is bleeding money, and you probably don't even realize it. Most teams operate with fragmented analytics scattered across disconnected tools, spreadsheets, and dashboards that never talk to each other. The result? You're flying blind on what actually drives revenue.
The stakes have never been higher. Customer acquisition costs have risen 60% over the past five years across the SaaS industry, which means growth through acquisition alone is becoming prohibitively expensive. Instead, retention has become your competitive edge. Yet the average SaaS company loses 5-7% of customers monthly, and 60-70% fail to hit the 5% churn benchmark that separates thriving businesses from struggling ones.

Here's the inflection point: over 80% of SaaS companies now use dedicated analytics platforms, making it table stakes rather than competitive advantage. The real differentiator is whether your analytics tool connects user behavior directly to revenue outcomes. Companies that implement revenue-first analytics stacks see up to 650% ROI improvement when properly executed.
The right tool doesn't just organize data. It reveals which customers are at risk, which features drive expansion, and where your acquisition dollars actually matter.
The Top SaaS Analytics Tools Compared: Features, Pricing, and Best Use Cases
The analytics tool you choose depends entirely on what you're trying to measure. Product behavior? Revenue metrics? User retention? Each tool has a distinct strength, and picking the right one saves months of wasted setup time.
Amplitude dominates when you need AI-powered prediction at scale. The platform excels at behavioral forecasting and predictive segmentation, letting enterprise teams spot churn risks before they happen. Amplitude leads in AI-powered behavioral prediction, while most tools rely on manual interpretation of cohort data. Ideal for mid-market and enterprise SaaS with complex user journeys; pricing reflects that premium positioning.
Mixpanel remains the gold standard for event-based tracking and funnel analysis. Product teams love it because every interaction gets captured and analyzed without guesswork. Mixpanel excels at product analytics, making it perfect if your team lives in dashboards tracking user behavior minute-by-minute.
PostHog flips the script with an open-source model that includes behavioral analytics, feature flags, and A/B testing in one platform. PostHog's free tier supports up to 1 million events monthly, which makes it the obvious choice for bootstrapped startups needing serious capabilities without serious costs.
ChartMogul and Baremetrics handle what others ignore: subscription revenue metrics. ChartMogul automatically pulls data from Stripe and billing systems, calculating MRR, churn, and LTV with zero manual work. Baremetrics specializes deeper into churn analysis, breaking down voluntary versus involuntary churn so you understand why customers leave. These aren't product analytics tools; they're revenue intelligence engines.
Heap solves a real problem: it captures events automatically without developers writing tracking code. No more waiting on engineering to instrument events. The tradeoff is less customization, but many teams accept that for speed.
Google Analytics 4 remains free and sufficient for web-first SaaS focused on traffic and conversion tracking. It won't replace dedicated product analytics, but it's a reasonable starting point if budget is tight.
The pattern here: behavioral tools (Amplitude, Mixpanel, Heap, PostHog) answer "what are users doing?" while revenue tools (ChartMogul, Baremetrics) answer "what's our business doing?" Most scaling SaaS companies eventually need both.
Behavioral Analytics vs Revenue Analytics: Which Tools You Actually Need
Here's the section:
Most SaaS teams treat behavioral and revenue analytics as interchangeable, then wonder why their dashboards tell conflicting stories. They're not the same thing, and conflating them costs real money.
Behavioral analytics tools like Mixpanel, Amplitude, and Heap answer one core question: what are users actually doing inside your product? They track feature adoption, conversion funnels, session flows, and retention patterns. You see which onboarding steps cause drop-off, which features drive engagement, and which user cohorts behave differently. This granular insight is invaluable for product teams optimizing the user experience.
But here's the problem: knowing that users love Feature X doesn't tell you if Feature X makes them pay more, stay longer, or expand their accounts. That's where revenue analytics enters.
Revenue analytics tools like ChartMogul and Baremetrics focus on subscription metrics that actually matter to your business. They track MRR (monthly recurring revenue), ARR (annual recurring revenue), customer lifetime value, churn rates, and expansion revenue. These tools answer the question every founder loses sleep over: is this growth real and sustainable?
The disconnect? B2B SaaS companies waste about 40% of marketing budgets when user behavior goes untracked, while those combining behavioral insights with revenue context see dramatically different results. Research shows revenue-first stacks that connect behavioral insights with CRM systems like HubSpot and Salesforce have delivered documented ROI improvements of up to 650%.
The best-performing SaaS companies run both in parallel. Behavioral data tells you what's working; revenue data tells you what's working for your business. Without that connection, you're optimizing in the dark.
Start with your biggest pain point. If you can't explain why customers churn, begin with behavioral analytics. If you can't forecast revenue or understand unit economics, prioritize revenue analytics first. Most teams eventually need both.
Reducing Churn and Improving Retention with Analytics: Actionable Strategies
Here's your section:
Churn is the silent killer of SaaS growth. But here's the good news: modern analytics tools don't just measure it, they prevent it. A modest 5% reduction in churn can double your growth rate and increase profits by 25% to 95%, making retention analytics one of the highest-ROI investments you can make.
The most effective SaaS churn analysis starts with identifying at-risk customers before they disappear. AI-powered churn prediction tools now reduce churn by approximately 15-20% through intelligent risk detection and response workflows. These tools work by monitoring usage patterns, feature adoption, and engagement velocity in real time, flagging accounts showing warning signs so your team can intervene quickly.
Cohort analysis reveals the deeper truth about your retention problem. By segmenting customers by onboarding date, plan tier, or feature adoption, you'll spot which groups stay loyal and which leak away. This insight lets you replicate what works and fix what doesn't. Maybe customers who hit a specific "aha moment" within their first week have 3x better retention. Now you know exactly what to optimize.
Health scoring automates this process. Assign point values to key behaviors: active users, feature usage, support tickets, payment health. Customers dropping below a threshold get flagged for proactive outreach. It's the difference between reactive cancellation management and predictive retention.
Here's a number most teams miss: up to 40% of churn is involuntary, caused by failed payments and expired cards. Dunning automation and retry logic recover this lost revenue immediately, with virtually no effort required.
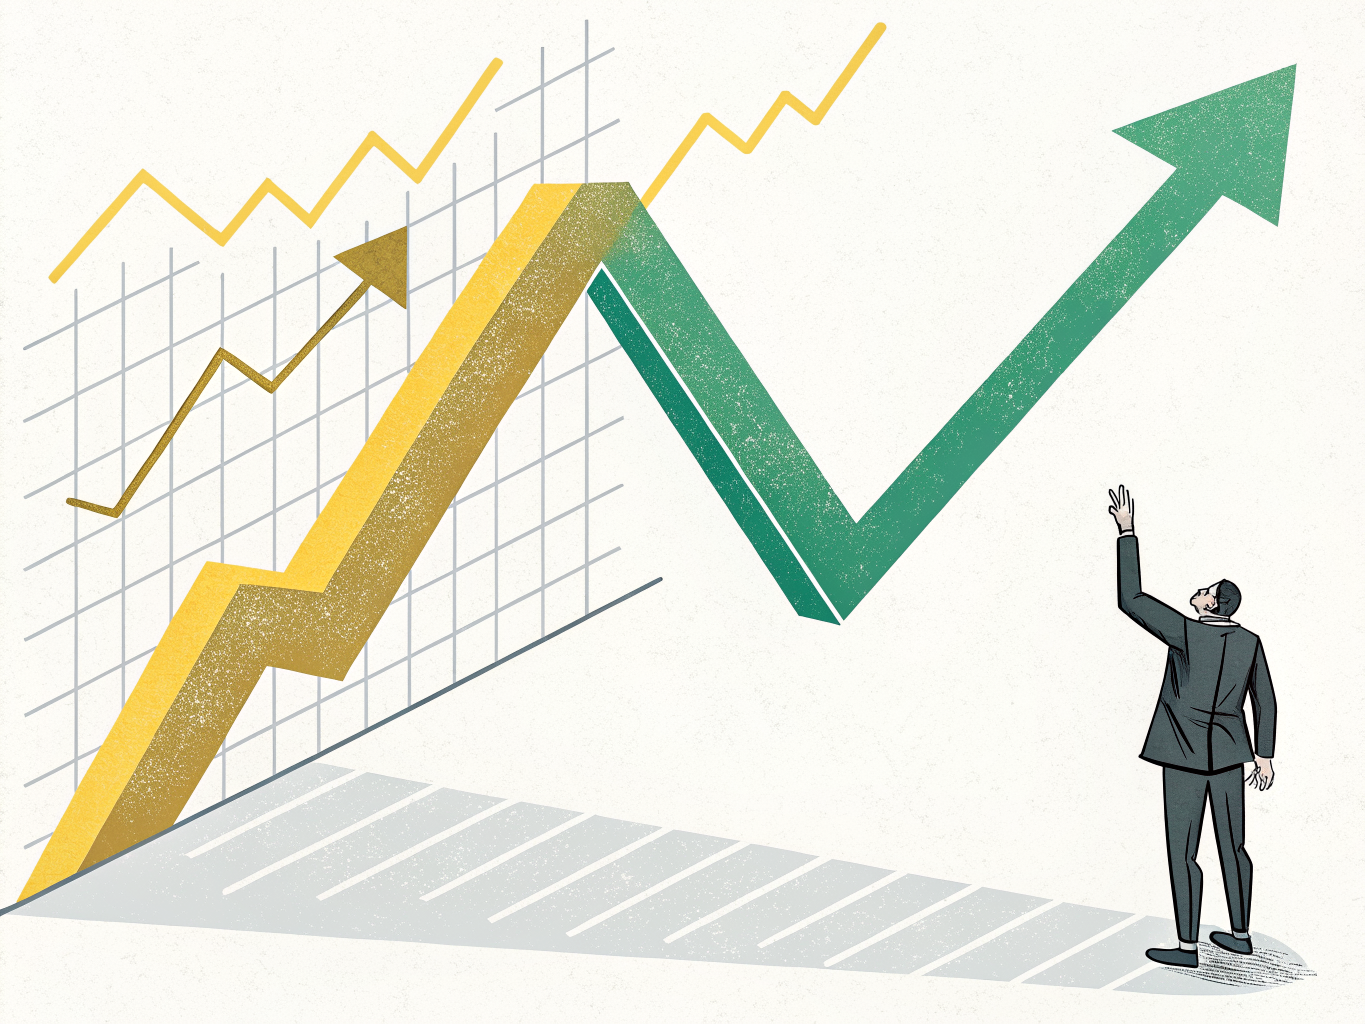
Finally, don't underestimate onboarding. Clear steps and aha moments boost retention by up to 50%. Use analytics to track which onboarding paths lead to activation and long-term engagement. Your customer retention analytics tool should show you exactly where users get stuck and drop off, letting you redesign for conversion.
AI-Powered Insights: The 2026 Game Changer for SaaS Analytics
Here's the section:
If you're still manually digging through dashboards to spot trends, you're already behind. In 2026, AI-powered analytics isn't a premium feature anymore; it's the baseline expectation.
The shift is real. Tools like ChartMogul now use AI for churn prediction and expansion opportunity scoring, while Amplitude's latest update includes AI-driven cohort predictions that forecast churn risk with precision that would've taken months of manual analysis two years ago.
What changed? Machine learning models now catch patterns humans miss. A slight drop in feature adoption, a missed engagement window, a shift in user behavior. These early warning signs surface automatically, letting you intervene before customers leave.
Natural language query interfaces make this accessible to everyone. With Power BI and Tableau's conversational analytics, your marketing manager can ask "which cohorts are most likely to upgrade this quarter?" without waiting for a data engineer. The AI translates plain English into complex queries instantly.
The real power is moving from reactive to proactive. Instead of analyzing churn after it happens, predictive segmentation identifies users likely to cancel or expand right now. Your retention team acts on data that matters before it's too late.
This isn't magic. It's statistical models running on your actual usage data, learning what healthy growth looks like versus what precedes churn. Every SaaS company has this information buried in their analytics platform. AI just extracts the signal from the noise.
The teams winning in 2026 aren't necessarily those with the smartest analysts; they're the ones letting AI handle pattern recognition so their people focus on strategy. That's the real competitive edge.
Implementation Best Practices: Avoiding the 70% Failure Rate
Here's the hard truth: 70% of analytics implementations fail because of poor setup and unclear event tracking. You can buy the fanciest platform on the market, but without proper groundwork, you're throwing money at a broken system.
The gap between tool selection and actual success lives in execution. Most teams skip the foundational work, jumping straight into dashboards before understanding what they actually need to measure.
Start here: define your core business metrics before you touch any tool. What moves your revenue needle? For SaaS companies, this usually means unit economics, churn rate, customer acquisition cost, and lifetime value. Write these down. Make them specific and measurable. This clarity prevents the sprawl that kills most implementations.
Next, obsess over event tracking. Clean data is non-negotiable. Map every customer interaction that matters: signups, feature usage, upgrade triggers, cancellation reasons. Bad event tracking corrupts everything downstream. Spend the time getting this right from day one.
CRM integration isn't optional either. Real success comes from connecting user behavior insights to revenue outcomes through careful implementation and CRM integration. Your sales team needs to see product usage data; your product team needs to understand revenue impact. These worlds must talk to each other.
Get cross-functional buy-in early. Product, marketing, and sales teams need aligned goals and visibility into shared KPIs. When everyone watches the same churn metric or activation rate, accountability follows naturally.
Finally, start small and scale deliberately. Early-stage companies should leverage free tiers and gradually expand as you mature and understand your data needs better. Avoid premature complexity that creates maintenance headaches.
The difference between the 30% that succeed and the 70% that fail? They did the unglamorous prep work first.
Frequently Asked Questions About SaaS Analytics Tools
What's the difference between product analytics and revenue analytics?
Product analytics tracks user behavior, feature adoption, and engagement patterns. Revenue analytics focuses on pipeline, customer lifetime value, churn, and expansion opportunities. Most growing SaaS companies need both; they answer different questions about different parts of your business.
How much do SaaS analytics tools cost in 2026?
Pricing varies wildly. According to recent analysis, you can build a solid reporting stack for $0-200/month using free tiers and open-source tools, or spend $5,000+ monthly for enterprise platforms. Most mid-market companies spend $500-1,500/month across their entire analytics stack.
How long does implementation take?
Basic setup takes 1-2 weeks. Full integration with your entire tech stack typically requires 4-8 weeks. The real timeline depends on data complexity and team bandwidth, not the tool itself.
Which tool works best for early-stage startups?
Amplitude, Mixpanel, or Plausible offer strong free tiers. Segment or Rudderstack handle data collection cheaply. Don't overspend on enterprise features you won't use yet; scale your tools as you grow.
Can I use multiple analytics tools together?
Yes. Most successful companies do. Use a data collection platform (Segment), a product analytics tool (Amplitude), and a BI platform (Metabase) together. They work better in combination than alone.
How do I measure ROI from analytics?
Track specific outcomes: faster decision-making, reduced churn, improved feature adoption rates, or revenue lift from data-driven changes. Set baseline metrics before implementation, then measure impact after 90 days.
Key Takeaways: Building Your Analytics Stack for Sustainable Growth
Building a winning analytics stack isn't about buying every tool on the market; it's about strategic combinations that connect user behavior to revenue impact.
Start with this foundation: pair a behavioral analytics platform (Amplitude or Mixpanel) with revenue-focused tools (ChartMogul or Baremetrics). Behavioral data tells you what users do; revenue metrics tell you why it matters. Together, they eliminate guesswork.
Implementation priorities matter. Launch with free tiers and scale incrementally as you grow. The good news: AI-powered features are now accessible at every price point, so you're not choosing between capability and budget. But here's the critical part: clean event tracking and CRM integration from day one aren't optional. Companies that skip this step face a 70% failure rate in their analytics initiatives.
Focus relentlessly on churn reduction first. A 5% improvement in retention doubles your growth rate and increases profits by 25-95%. Use cohort analysis and health scoring to identify at-risk customers before they disappear. This isn't theoretical; it's the fastest path to sustainable growth.
Finally, align your entire organization around core metrics. Analytics only works when retention becomes a cross-functional priority, not just a customer success issue. Engineering, product, marketing, and sales all need visibility into the same metrics and shared accountability for outcomes.
Your analytics stack is only as powerful as the decisions it drives. Choose tools that your team will actually use, implement them properly, and obsess over the metrics that move the needle.
Start Your Analytics Journey Today: Next Steps for SaaS Leaders
The cost of inaction is steeper than you think. Every quarter without proper analytics visibility means missed revenue opportunities, preventable churn, and decisions made on incomplete information. The tools exist. The data exists. What's missing is implementation.
Here's your starting point: this week, audit your current analytics gaps. Document where your data lives now (spreadsheets, disconnected dashboards, scattered tools) and identify the metrics that actually matter to your business. Revenue retention rate. Customer acquisition cost. Expansion revenue. Pick three core metrics that directly impact your growth.
Next, schedule demos with two or three tools that match your use case and budget. Don't aim for perfection; aim for progress. Ask vendors about event tracking setup and CRM integration capabilities from day one, not as an afterthought.

Then commit to something concrete: a specific churn reduction target and a timeline. Share it across your team. Analytics only works when insights drive action.
Your fragmented data problem won't solve itself. Start today.
Go deeper in the Learning Hub
Try Arktis free for 7 days
Attribution tracking, session recordings, and AI automation in one platform. Set up in 2 minutes, free for 7 days.
Start 7-day free trial