
SaaS Churn Analysis: Complete Guide to Metrics & Reduction
Last Updated: March 5, 2026 Quick Summary SaaS churn is the percentage of customers canceling subscriptions; average B2B rate is 3.5% Distinguish between volunt...

Last Updated: March 5, 2026
Quick Summary
- SaaS churn is the percentage of customers canceling subscriptions; average B2B rate is 3.5%
- Distinguish between voluntary (2.6%) and involuntary (0.8%) churn; they need different fixes
- Revenue churn matters more than customer churn; losing high-value customers impacts growth
- Onboarding, product usage monitoring, and payment recovery prevent 30%+ of avoidable churn
- Negative net revenue churn signals healthy expansion outpacing customer losses
What Is SaaS Churn Analysis and Why It Matters
SaaS churn is the percentage rate at which customers cancel their recurring subscriptions, according to Maxio's churn metrics guide. But here's what makes it different from other business metrics: churn is backward-looking data with forward-looking consequences.
Every customer who leaves represents lost revenue, but more critically, it signals something broken in your product, pricing, or customer experience. This is why churn has earned its reputation as the silent killer of recurring revenue, affecting everything from your monthly recurring revenue (MRR) and annual recurring revenue (ARR) to your customer acquisition cost payback period and overall company valuation.
Here's the brutal math: if you're acquiring customers faster than you're losing them, growth masks the problem. But the moment growth slows, churn becomes your ceiling. Investors know this. They scrutinize churn rates because low churn signals strong product-market fit and durable revenue; high churn signals the opposite, no matter how impressive your acquisition numbers look.
Whether you're a founder, product leader, or growth manager, understanding your churn isn't optional. It's the difference between sustainable growth and a treadmill that exhausts your resources while revenues stall.
Understanding SaaS Churn Metrics: Types and Calculations
Here's the thing: not all churn is created equal, and counting lost customers tells only half the story.
Customer churn (also called logo churn) measures how many customers you've lost as a percentage of your total customer base. It's straightforward: lose 10 customers out of 100, you have 10% customer churn. But here's where it gets interesting. You could lose a small customer paying $500/month while retaining a massive enterprise account paying $50,000/month. Your revenue barely moved, yet your churn metric looks alarming.
That's where revenue churn enters the picture. This metric tracks the recurring revenue you've lost from existing customers, expressed as a percentage of your total monthly recurring revenue (MRR). As one analysis notes, "losing a customer means losing revenue, but losing revenue doesn't always mean losing a customer" Lighter Capital's analysis. A customer downgrading their plan counts as revenue churn without being a lost customer entirely.
Now add gross versus net churn into your framework. Gross churn is the raw revenue lost from cancellations and downgrades. Net churn accounts for expansion revenue, upgrades, and upsells from existing customers. This distinction matters enormously. Net MRR churn can actually be negative, meaning expansion revenue outpaces customer losses, which signals a healthy business despite customer departures.
Finally, understand the difference between voluntary and involuntary churn. Voluntary churn happens when customers actively decide to leave, typically due to product fit issues or competitive alternatives. Involuntary churn stems from operational failures like failed payment processing or expired credit cards. These require completely different remedies.
The complete picture emerges only when you track these metrics together. A rising customer churn paired with declining net revenue churn suggests your remaining customers are spending more, offsetting losses. That's actionable intelligence that a single metric never provides.
SaaS Churn Benchmarks: What's Healthy in 2025-2026
Here's the thing: there's no universal "good" churn rate. A 5% monthly churn rate might be catastrophic for an enterprise software company but perfectly acceptable for a marketing automation tool. Context matters enormously, and understanding where you actually stand requires looking beyond industry averages.
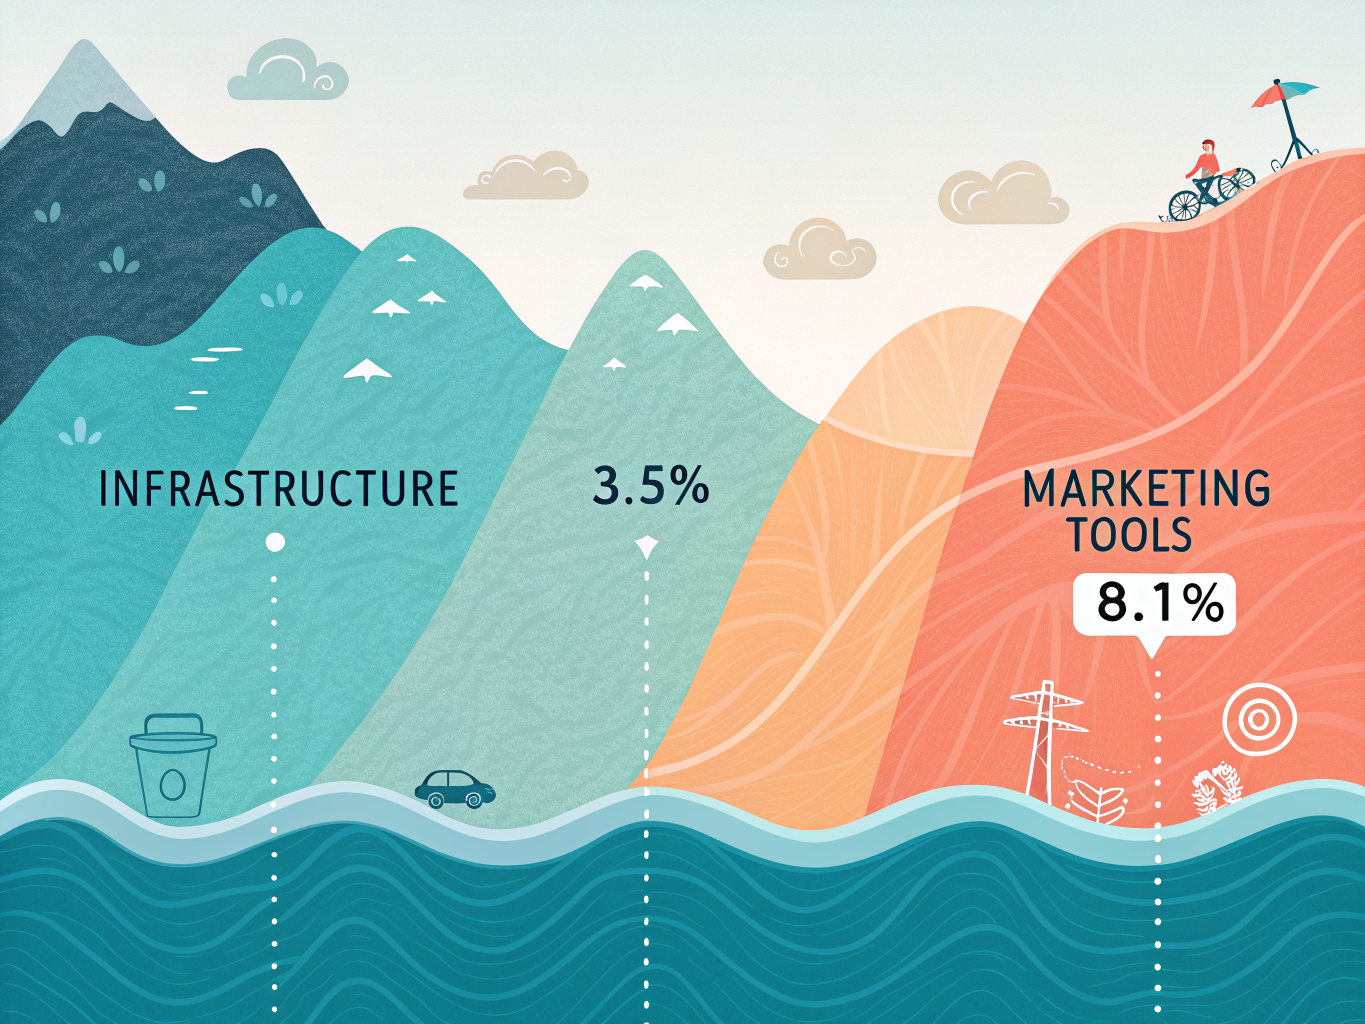
The baseline data tells part of the story. Average B2B SaaS churn is 3.5%, split between voluntary (2.6%) and involuntary (0.8%). But that number obscures massive variation across segments.
Industry vertical is your first lens. Infrastructure SaaS demonstrates the lowest churn at 1.8% monthly due to high switching costs, making migration painful and expensive. On the opposite end, marketing tools cluster between 4.8% and 8.1% monthly churn, where customers constantly experiment with new solutions and switching friction is minimal. Your competitive landscape directly shapes what "healthy" looks like.
Company maturity compounds this. Pre-PMF companies experience 4.3x higher churn than established SaaS businesses, which makes sense: you're still finding product-market fit, customers haven't fully adopted your solution, and retention infrastructure is minimal. Early-stage founders shouldn't panic at double-digit churn; they should focus on understanding why customers leave.
To benchmark meaningfully, find peers in your specific segment, not just your industry. Compare against companies at similar maturity stages with comparable customer acquisition costs and deal sizes. Your churn rate relative to those peers reveals whether you have a real problem or simply operate in a high-churn category. That distinction changes everything about your strategy.
Root Causes of SaaS Churn: What's Really Making Customers Leave
Here's the hard truth: your customers aren't leaving because they're fickle. They're leaving because something broke in their experience with your product.
The culprit usually falls into one of five categories. Let's diagnose which ones are bleeding your revenue.
Onboarding failure is the biggest killer. 40-60% of free trial users use it once and never come back. They sign up, get lost in your interface, and ghost you. This isn't about your product being bad; it's about customers not understanding how to use it or why they should care. Over 50% of B2B SaaS customers quit if they don't fully understand how to use the product.
Low product adoption happens when customers see features but never use them. They're not getting value because they don't know value exists. This signals a gap between what they expected and what they're experiencing.
Product-market fit issues run deeper. Your customer's needs shifted, or your product didn't evolve with them. Maybe they outgrew you, or you're solving yesterday's problem instead of today's.
Pricing friction and payment failures account for real money lost. 0.8% of churn is involuntary, driven by failed payments and billing issues. This is revenue you could save with better payment recovery systems.
Here's what to do: pull your churned customer data and categorize exits by reason. Did they never log back in after day one? That's onboarding. Did they use the product once a month instead of daily? That's adoption. Did they complain about price before leaving? That's pricing sensitivity.
You can't fix what you don't measure. Once you know which cause is costing you the most, you can actually address it.
Proven Strategies to Reduce SaaS Churn: Actionable Playbook
The good news: churn isn't inevitable. Companies that act strategically across the customer lifecycle see dramatic improvements, often within months.
Start with onboarding, not marketing. Your first impression determines everything. Effective onboarding can increase customer retention by 50%, and 86% of customers are more likely to stick around when the onboarding process is clear and welcoming. Stop assuming customers will figure things out. Map the critical path to their "aha moment" (the point where they experience real value), then build guided workflows to get them there faster. Track onboarding completion rates by cohort. If 40% of users never finish setup, you've found your first leverage point.
Watch usage patterns like a hawk. Real-time usage monitoring reveals at-risk customers before they disappear. Set up alerts for red flags: sudden login drops, feature abandonment, or declining API calls. When you spot these signals early, you can intervene with targeted support, relevant feature education, or even a conversation with their champion. Prevention beats recovery every time.
Recover involuntary churn automatically. Payment failures aren't the customer's fault, but they cost you revenue. Retrying failed payments through automation recovers 70% of otherwise lost revenue. Implement smart retry logic with multiple payment methods, and send clear, helpful notifications when cards decline. This is money left on the table if you ignore it.
Learn from departing customers. Exit surveys answer the question every founder asks: "Why did they leave?" Don't make them long. Ask one or two specific questions about their primary reason, then follow up with a personal outreach. Some churn is preventable; some isn't. But the patterns you discover inform your entire product and retention strategy.
The sequence matters. Perfect onboarding first, then activate usage monitoring, then layer in payment recovery. Each step builds on the last. Companies executing all four strategies see compounding effects.

Churn Analysis Tools and Metrics You Should Track
You need three core metrics to understand churn systematically: Net Revenue Retention (NRR), cohort analysis, and early warning indicators.
Net Revenue Retention is your most comprehensive churn metric because it captures the full picture. While gross churn shows customer losses, NRR includes expansion revenue from existing customers. A healthy SaaS company targets NRR above 110 percent, meaning you're growing revenue despite some customer attrition. This matters most to finance and executive teams evaluating business health.
Cohort analysis reveals which customer segments churn fastest. Group customers by acquisition date, plan tier, or industry, then track retention rates over time. You'll quickly spot patterns: maybe annual contracts retain better than monthly ones, or enterprise customers churn less than SMBs. Product and customer success teams use this to prioritize retention efforts where they'll have the biggest impact.
Early warning signals let you intervene before customers leave. 60 percent of SaaS companies monitor product usage and activity to identify churn risks. Track login frequency, feature adoption rates, and support ticket volume. Login frequency and length of first session are the most significant red flag metrics, signaling disengagement weeks before cancellation.
Don't forget the LTV to CAC ratio. If your customer lifetime value is less than three times your acquisition cost, your unit economics are broken. This guides marketing and sales on sustainable growth.
For implementation, start with your billing platform's built-in analytics, then layer in tools that track product usage. The best setup combines financial metrics for leadership with behavioral signals for operational teams. Different stakeholders need different views of the same data.
Key Takeaways: Your Churn Reduction Action Plan
Here's your action plan to stop the bleeding and build lasting retention:
Immediate wins (this week):
- Audit how you're calculating churn. Churn is often misunderstood and miscalculated across organizations, so distinguish between customer churn and revenue churn first. They tell completely different stories.
- Recover involuntary churn today. About 70% of failed payments can be recovered automatically with retry logic and payment method updates. This is free money left on the table.
- Identify your at-risk customers using usage signals. Set up real-time alerts for declining logins, feature adoption drops, or support ticket spikes.
Long-term strategy (next 30-90 days):
- Overhaul your onboarding. The first 90 days can determine long-term retention, so map the critical path to value and remove friction.
- Benchmark against your actual peers. Ignore industry averages; compare yourself to companies at your stage with similar pricing models.
- Build a retention playbook. Document what works for your segments and automate it.
Start with involuntary churn recovery this week. It's the fastest path to measurable results.
FAQ: Common Questions About SaaS Churn Analysis
What counts as a good churn rate? Average B2B SaaS churn sits at 3.5% monthly, but your target depends on company stage and industry. Early-stage startups typically see 5-7%; mature companies should aim lower. The real metric: are you losing customers faster than you're acquiring them?
How do I actually calculate churn? Simple formula: divide customers (or revenue) lost during a period by your starting base. Lost 5 customers from 100? That's 5% monthly churn. The key is consistency; pick monthly or annual and stick with it.
Is all churn bad? Not entirely. Negative churn happens when expansion revenue exceeds customer losses, meaning your existing base grows faster than people leave. That's the endgame most SaaS companies chase.
Why does onboarding get mentioned constantly? Because it works. Customers with smooth onboarding experiences show significantly higher retention. Poor onboarding is often where involuntary churn (failed payments, forgotten logins) begins.
Can I recover involuntary churn? Absolutely. Around 70% of involuntary churn can be recovered through payment automation and retry logic. It's money left on the table if you're not addressing it.
Where should I focus first? Start with your largest churn segment: voluntary or involuntary? B2B or SMB? Then dig into exit reasons through surveys and support tickets. You can't fix what you don't understand.
Conclusion: Churn Analysis as Your Competitive Advantage
The companies winning in 2025 are those that retain customers better than they acquire them. This isn't aspirational thinking; it's the economic reality of SaaS. SaaS companies that will win in 2025 are those that retain customers better than they acquire them.
Here's what matters: churn analysis is fundamentally a data problem. It requires systematic measurement, honest diagnosis, and relentless action. The good news? You don't need perfect data or advanced analytics to start winning. You need clarity on what's actually happening with your customers, then the discipline to fix it.
The math is compelling. Reducing churn by even a few percentage points often has more impact on ARR than winning new logos. That's not hyperbole; it's measurable reality. Small improvements in retention compound into massive revenue differences over time.

Stop planning. Start executing. Pick one high-impact strategy right now: either fix your onboarding experience or eliminate payment failures. Measure the baseline, implement the change, track the results. Use tools like Arktis or your existing analytics platform to monitor progress.
Your competitive advantage isn't complex. It's choosing to act on data while others debate it.
Go deeper in the Learning Hub
Try Arktis free for 7 days
Attribution tracking, session recordings, and AI automation in one platform. Set up in 2 minutes, free for 7 days.
Start 7-day free trial