
Stickiness in Analytics: What It Is and How to Measure It
Last Updated: March 18, 2026 Key Takeaways Stickiness measures how often users return using the DAU/MAU ratio, a leading indicator of product health Industry be...

Last Updated: March 18, 2026
Key Takeaways
- Stickiness measures how often users return using the DAU/MAU ratio, a leading indicator of product health
- Industry benchmarks range from 15-30% for fintech to 50-80% for social apps; 20%+ is strong
- High stickiness signals product-market fit, reduces churn, and compounds lifetime value
- Stickiness differs from retention: it's organic habit formation vs. re-engagement tactics
- Improve stickiness by solving recurring needs, personalizing experiences, and tracking engagement patterns
What Is Stickiness in Analytics?
Stickiness measures how frequently users return to your product over time, calculated as the ratio of Daily Active Users (DAU) to Monthly Active Users (MAU). It's a simple formula with profound implications: user stickiness is defined as the ratio of Daily Active Users (DAU) to Monthly Active Users (MAU), measuring how often customers engage with a product on a regular basis. A stickiness ratio of 0.5, for example, means that half your monthly users return on any given day. That's not just engagement; that's habit.
Why should you care? Because stickiness is where growth actually happens. Engagement drives stickiness, which drives retention, and that in turn drives growth. Unlike vanity metrics that spike and fade, stickiness reveals whether your product has become essential to users' daily workflows. It's the difference between someone trying your app once and someone who can't imagine their day without it.
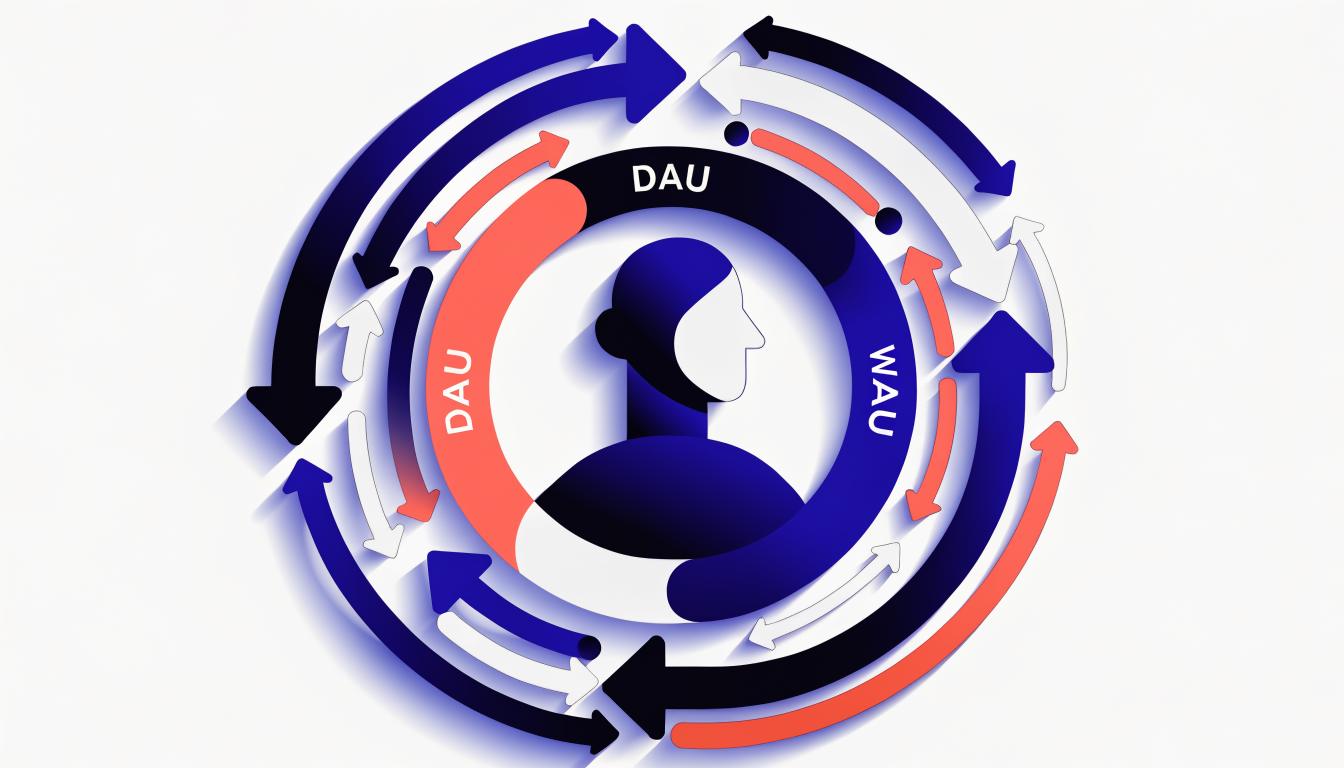
This matters to your revenue because high stickiness directly reduces churn, deepens feature adoption, and maximizes customer lifetime value. Stickiness is one of the strongest signals of loyalty and product market fit. It tells you whether you've solved a real problem or built something users tolerate. The products that scale fastest aren't those with the most downloads; they're the ones users can't live without. That's stickiness. And it's measurable, actionable, and directly tied to your bottom line.
How to Calculate the Stickiness Ratio
The math behind stickiness is refreshingly straightforward. The formula divides daily active users by monthly active users, then multiplies by 100 to express the result as a percentage: (DAU / MAU) × 100 = Stickiness Percentage.
Let's work through a concrete example. Imagine your product had 50,000 unique users in March. On March 15th specifically, 12,500 of those users logged in and performed a meaningful action. Your calculation would be (12,500 / 50,000) × 100 = 25%. This means one-quarter of your monthly user base engaged on that particular day.
Here's the critical part: you need to define "active" consistently before you start calculating. Does active mean logging in? Completing a transaction? Spending a minimum amount of time in your product? The key is having an accurate definition of what active means, which can vary depending on your business type. Once you've decided, lock that definition into your analytics tool and stick with it. Changing your definition mid-analysis will make your data unreliable and trends impossible to interpret.
For daily collection, pull your DAU and MAU numbers from your analytics platform each day, then calculate the ratio. You'll notice daily stickiness bounces around significantly. Monday might show 28% while Wednesday dips to 22%. This noise obscures real patterns, so calculate a rolling 7-day or 30-day average instead. This smooths out the fluctuations and reveals whether your stickiness is actually trending up or down.
Not all products fit the DAU/MAU model perfectly. If your users typically engage weekly rather than daily, try WAU/MAU (weekly active users divided by monthly active users). For highly engaged communities, DAU/WAU shows how many daily users return multiple times per week. Choose the ratio that matches your product's natural usage rhythm.
The beauty of stickiness metrics is their simplicity paired with their predictive power. A single percentage tells you whether users are coming back, which is often a better predictor of revenue than raw user counts. Start calculating today, and you'll have baseline data to improve against tomorrow.
Stickiness vs. Retention: What's the Difference?
Stickiness and retention sound like they measure the same thing, but they're fundamentally different, and understanding the distinction changes how you approach growth.
Stickiness measures habit formation and organic interest in returning to your product. It's about whether users naturally come back because they find genuine value in what you've built, typically measured over short windows like daily or weekly usage. Think of it as the involuntary pull your product exerts on users' behavior.
Retention, by contrast, measures whether customers stay with you over longer periods: weeks, months, or years. It's a broader measure of loyalty and lifetime value. Importantly, retention is heavily influenced by re-engagement tactics like push notifications, email campaigns, and in-app messaging. These external nudges keep users in your ecosystem even when they're not organically drawn back.
Here's where the distinction matters for strategy: 
A product can have strong retention but low stickiness if users only log in occasionally, typically when prompted. Conversely, you might see high stickiness with poor retention if usage is intense but short-lived. The ideal scenario combines both: organic habit formation that compounds into lasting loyalty.
High stickiness typically leads to strong retention naturally, since habitual users require fewer external incentives to stay. But relying solely on retention metrics without monitoring stickiness means you're propping up engagement artificially. Together, these metrics reveal the complete story of whether your product is truly sticky or just sticky-adjacent.
Industry Benchmarks and What Counts as Good Stickiness
Understanding where your product stands requires context. Stickiness benchmarks vary dramatically by industry, business model, and use case, so comparing your metrics to the wrong reference point can lead you astray.
Social and messaging apps set the highest bar, with DAU/MAU ratios between 50-80%. WhatsApp and Slack exemplify this; Slack maintains roughly 60% daily active users relative to monthly actives, reflecting the always-on nature of workplace communication. These products are designed for frequent, often real-time interaction.
Productivity tools occupy the middle ground at 40-60% stickiness. Unlike messaging apps, tools like project management software or note-taking platforms don't demand constant engagement, but work rhythms drive consistent daily or near-daily usage. The expectation here is regular habit formation, not constant connectivity.
Fintech and e-commerce products operate in a different reality entirely. Stickiness typically ranges from 15-30% because users complete tasks infrequently. You check your banking app when you need to transfer money, not every day. That's not a weakness; it's the nature of the product.
For most SaaS products, 20% stickiness is considered solid, while anything above 25% signals exceptional product-market fit. These thresholds give you a reasonable target, but they're starting points, not finish lines.
The real trap is benchmarking against the wrong category. A fintech app hitting 25% stickiness is performing exceptionally. That same metric for a social platform would indicate serious problems. Before comparing yourself to industry standards, honestly assess your product's purpose. Is daily engagement realistic or even desirable? That answer determines whether your stickiness score represents strength or weakness.
Advanced Stickiness Metrics Beyond DAU/MAU
While DAU/MAU gives you the headline number, it masks critical nuances about how users actually engage with your product. Advanced metrics fill those gaps and reveal patterns that drive real retention improvements.
Lness measures how many distinct days a user returns within a period. L19+/28 shows the percentage of users who visit at least 19 times per month, giving you granular visibility into frequency patterns. This matters because a user with 10 visits spread across 25 days behaves differently from someone with 10 visits crammed into 3 days; Lness captures that distinction.
WAU/MAU (weekly active users divided by monthly active users) works better for products with natural weekly rhythms. If your tool powers weekly workflows, this ratio tells a truer story than DAU/MAU, which can undervalue legitimate usage patterns.
Session duration indicates engagement depth. A user spending 45 minutes per visit shows different stickiness quality than someone logging in for 90 seconds, even if both visit equally often. It's a proxy for whether your product delivers real value during each interaction.
Retention curves track cohort behavior over time, answering the question: which groups of users actually stick around? Plotting retention by signup month, feature adoption, or acquisition channel reveals which segments are genuinely sticky versus which need intervention.
The key is choosing metrics that match your product's actual usage patterns. A fitness app needs different stickiness measurements than project management software. Segment your analysis by cohort, feature, or channel to move from observation to action. These advanced metrics transform raw engagement data into strategic insights worth acting on.
How to Improve Your Product's Stickiness
The path to higher stickiness starts with solving a real problem your users face repeatedly. Not occasionally, not theoretically, but something they encounter daily or weekly. If your product addresses a genuine recurring need, you've already won half the battle. The other half is making sure users experience that value immediately.
Your onboarding is ground zero. Users decide within the first session whether your product deserves their attention. Skip the feature tour; show them the payoff instead. Get them to that "aha moment" fast, where they see themselves using your product to solve their specific problem.
Once they're in, feature discovery matters more than you might think. Tooltips, in-app walkthroughs, and contextual guidance help users uncover functionality that deepens their engagement. Feature discovery leads to more product usage, which leads to more value and thus more stickiness. The key is making these discoveries feel natural, not intrusive.
Personalization compounds stickiness over time. Use behavioral data to customize experiences for different user segments. One group might need daily reminders; another responds better to weekly digests. Segment your users ruthlessly and identify which cohorts are stickiest. Then reverse-engineer why. What are they doing differently? What features do they use most?
Feedback loops accelerate improvement. A/B test your engagement campaigns, onboarding flows, and notification strategies. Iterate based on what actually drives repeated visits, not what sounds good in theory. Push notifications and personalized in-app messages work when they're timely and relevant, not when they're noise.
Finally, build social proof into your product. Community features, user achievements, and peer recognition reinforce habit formation. When users see others getting value, they're more likely to stick around.
The compounding effect is real. Small improvements in stickiness create outsized revenue impact over months and quarters. Start with one recurring problem, measure your progress, then layer in the next tactic. Consistency beats perfection every time.
Using Stickiness Data to Drive Revenue Growth
Stickiness isn't just a vanity metric; it's a direct lever on your bottom line. Users who engage regularly with your product generate predictable revenue streams, lower churn rates, and substantially higher lifetime value. When your stickiness ratio improves by even 10 percent, you're looking at measurable reductions in customer acquisition costs relative to revenue per user.
The connection runs deeper than retention alone. Sticky users become your expansion engine. They're more likely to discover and adopt additional features, upgrade their plans, or increase seat counts. They're also your most credible advocates; high stickiness leads to organic growth through word-of-mouth and referrals, which compounds your marketing efficiency over time.
Use stickiness segmentation to identify at-risk cohorts before they churn, allowing your success team to intervene strategically. Simultaneously, analyze which user behaviors correlate with high stickiness to refine your ideal customer profile. This sharpens acquisition targeting and improves marketing ROI by focusing spend on prospects most likely to stick around.
Modern analytics platforms can automate this detective work, tracking user journeys and surfacing stickiness drivers without manual analysis. The result: faster decisions, better resource allocation, and a product roadmap informed by what actually keeps users engaged and paying.
Common Mistakes When Measuring Stickiness
Stickiness is a powerful metric, but it's easy to misinterpret. Here are the pitfalls that trip up most teams.
Treating stickiness as your only engagement signal is the biggest mistake. A 40% DAU/MAU ratio looks great until you realize your users visit daily but never convert. Stickiness tells you frequency, not value. Pair it with retention curves, LTV, and feature adoption to get the full picture.
Defining 'active' inconsistently across tools destroys comparability. Is an active user someone who logged in, clicked anything, or completed a meaningful action? If your analytics platform, product team, and finance department use different definitions, you're comparing apples to oranges. Lock in one definition and document it everywhere.
Celebrating high stickiness from a tiny user base is dangerously misleading. If 10 power users visit daily, your stickiness might spike to 70%, but that's not predictive of broader product success. Always check your denominator and consider whether your cohort is large enough to be meaningful.
Ignoring cohort differences assumes all users behave identically, which they don't. Users acquired through organic channels often show different stickiness patterns than paid cohorts. Mobile users may have lower DAU/MAU than desktop users. Segment by acquisition channel, device, user persona, and feature usage to identify real drivers.
Failing to investigate why stickiness changes turns the metric into a vanity number. Did it drop because of a bug, a UI change, or seasonal behavior? Did it spike because of a new feature or artificial engagement tactics? Root cause analysis separates signal from noise and points toward actionable growth levers.
Key Takeaways
Stickiness is your product's heartbeat. A DAU/MAU ratio above 20% signals strong habit formation; anything below 10% suggests users aren't returning consistently. Calculate it the same way every time, define "active" clearly, and track it weekly rather than monthly to catch trends early.
Here's what matters most: benchmark against your industry, but obsess over your own trajectory. A 2% monthly improvement in stickiness compounds into significant retention gains and lower churn. Don't stop at DAU/MAU either. Layer in WAU/MAU to spot weekly engagement patterns, and segment by cohort, feature, and acquisition channel to pinpoint exactly where users stick and where they drop off.
The real leverage comes from acting on what stickiness reveals. If a specific feature drives higher retention, double down. If users from one acquisition channel show weaker stickiness, adjust your messaging or targeting. Solve recurring friction points, personalize experiences based on usage patterns, and iterate relentlessly.
Modern analytics platforms can automate this tracking and surface which touchpoints drive engagement, freeing you to focus on strategy. Start measuring stickiness today. Track it consistently. Compare cohorts. Then build your product around what keeps users coming back.
Measure and Improve Stickiness with Arktis
Measuring stickiness is only half the battle. The real power emerges when you connect those repeat engagement patterns to the specific touchpoints that drive them. A user might return to your product weekly, but without understanding which feature, email campaign, or onboarding moment created that habit, you're missing the lever to scale it.
This is where comprehensive customer journey tracking becomes essential. You need visibility into every interaction, from the initial ad click through signup, first feature use, and repeat purchases. When you can see the full path, stickiness metrics transform from vanity numbers into actionable intelligence.
The best part: modern analytics platforms can now identify stickiness drivers automatically through AI, then act on those insights in real-time. Personalized re-engagement workflows trigger at precisely the right moment, based on what actually keeps users coming back. When you combine stickiness data with conversion metrics, you stop optimizing for engagement in a vacuum. Instead, you optimize for frequency that matters: the kind that drives revenue.
Start by auditing your current touchpoints. Which ones correlate strongest with repeat behavior? That's your starting point for meaningful growth.
Go deeper in the Learning Hub
Try Arktis free for 7 days
Attribution tracking, session recordings, and AI automation in one platform. Set up in 2 minutes, free for 7 days.
Start 7-day free trial