
Understanding Cohorts: A Complete Guide for Beginners
Last Updated: March 17, 2026 Key Takeaways Cohorts are groups of customers sharing common characteristics, tracked over time to reveal behavior patterns Cohort...

Last Updated: March 17, 2026
Key Takeaways
- Cohorts are groups of customers sharing common characteristics, tracked over time to reveal behavior patterns
- Cohort analysis uncovers what aggregate metrics hide: which segments churn fastest and which drive revenue
- Three main types: acquisition cohorts, behavior cohorts, and predictive cohorts answer different business questions
- Cohort analysis is essential for SaaS and ecommerce to reduce churn, improve retention, and optimize marketing
- Most businesses struggle with cohort analysis due to data infrastructure gaps and difficulty turning insights into action
What Are Cohorts? The Definition You Need to Know
A cohort is simply a group of customers who share a common characteristic or experience within a defined time period, tracked together to reveal how they behave over time. That's it. But this simple definition unlocks something powerful that most businesses miss.
Here's the problem with looking at all your customers as one big blob of data. If you tell your boss "our retention rate is 85%," that sounds solid. But that number could hide a dangerous truth: maybe your customers from January stick around at 95%, while your November cohort is dropping off at 60%. One aggregate metric masked two completely different stories.
Cohorts force you to stop treating every customer the same and start seeing the patterns that actually matter. According to Stripe's analysis of cohort data, a stable retention rate might hide the fact that new customers are leaving far faster than older ones keeping your numbers steady. That's the insight that changes decisions.
When you segment customers into cohorts, you're asking questions like: Do customers acquired in Q1 behave differently than Q2 customers? Do people who signed up via email convert better than those from social? Do subscription tiers show different churn patterns over time? Suddenly, your data tells a story instead of just providing noise.
This matters because patterns reveal what's working and what isn't. A cohort showing strong month-three engagement tells you something about your onboarding. A cohort with sudden drops tells you where customers get frustrated. These aren't just numbers; they're the roadmap to fixing what's broken and scaling what works.
How Cohorts Work: The Core Mechanics
A cohort is simply a group of customers who share something in common within a specific time frame. That shared characteristic might be when they signed up, what they purchased, where they're located, or how they first discovered your product. The key is the time boundary. Without it, your grouping becomes too loose to reveal meaningful patterns.
Here's how the process actually works. First, you define your cohort based on a characteristic that matters to your business. Most commonly, this is acquisition date: "all customers who signed up in January 2024" becomes one cohort, "February 2024" becomes another. Next, you collect behavioral data for each person in that group. Did they return? Did they upgrade? How much did they spend? Then you organize this data into a table or chart where rows represent your different cohorts and columns represent time periods after they joined.

When you compare the January cohort's retention rate to February's, patterns emerge that aggregate data completely masks. Perhaps January customers drop off faster in month two, suggesting a seasonal quality issue. Maybe February's cohort stays more engaged, indicating a successful product change. These insights drive real decisions. Without cohorts, you're looking at averages that obscure what's actually happening beneath the surface. You see a blurry picture; cohorts bring it into focus.
Types of Cohorts: Which One Fits Your Business?
Not all cohorts are created equal. The type you choose depends on what you're trying to understand about your customers. Three main categories dominate the field, each answering fundamentally different questions about your business.
Acquisition cohorts group customers by when they signed up or made their first purchase. These are time-based groupings that let you track how different "vintage" groups behave over their lifetime. If you launched a new marketing campaign in March, you might compare March cohorts to January cohorts to see if the newer users stick around longer or spend more. Acquisition cohorts classify customers by when they were acquired or first engaged with a product or service. They're excellent for spotting seasonal patterns and measuring the long-term impact of acquisition initiatives.
Behavior cohorts take a different angle entirely. Rather than when someone joined, they focus on what actions customers took. Did they enable notifications? Complete onboarding? Upgrade their plan? You group users by these specific behaviors and watch how they progress. This is where the real insight lives: behavior cohorts reveal what actually drives long-term success versus what merely looks good on surface metrics.
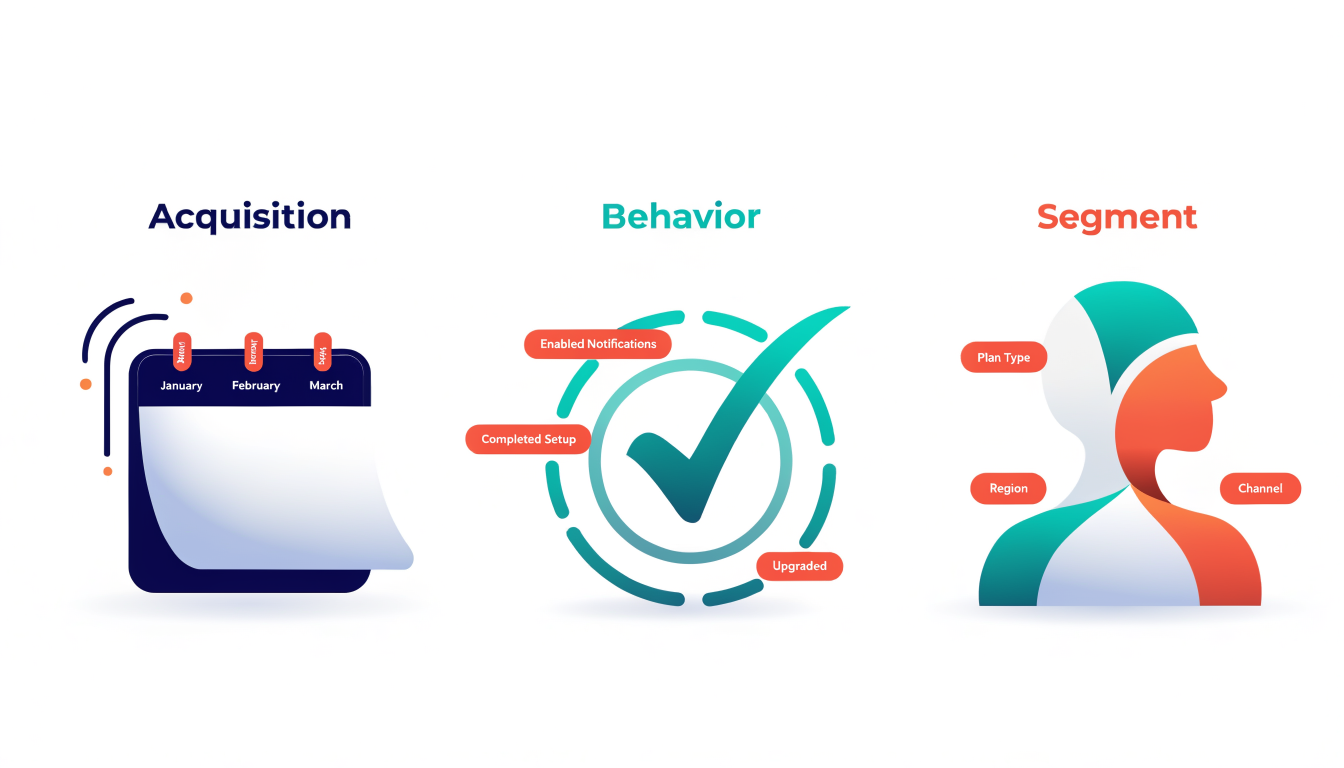
Segment cohorts organize customers by characteristics: geography, plan type, demographics, or acquisition channel. If you run a SaaS platform, you might compare Enterprise customers to Starter customers. Or compare users acquired through organic search to those from paid ads. These cohorts answer questions about which customer segments drive the most value.
Finally, predictive cohorts represent the advanced frontier. Using machine learning, these group users by forecasted future behavior rather than past actions. As Stripe's analysis shows, predictive cohorts tell you who you should contact right now. Start with acquisition, behavior, and segment cohorts to build your foundation. Once you understand your data, predictive cohorts become the multiplier.
Why Cohort Analysis Matters for SaaS and Ecommerce
For SaaS companies, cohort analysis transforms how you approach one of your biggest business threats: churn. While SaaS businesses generally should aim for a yearly churn of 5% or under, most struggle to pinpoint where customers actually drop off. Cohorts reveal this immediately. You can see which customer cohorts stay engaged month after month and which ones vanish after their first sprint. This isn't abstract; it's the difference between a thriving business and one bleeding revenue.
For ecommerce, cohort analysis solves a more insidious problem. Most brands obsess over short-term ROAS and conversion rates, completely missing the real profitability story. A campaign might look fantastic on day one but deliver customers who never return. Cohorts show you which acquisition channels and campaigns deliver genuine long-term value versus those that just inflate your top line.
Beyond churn and acquisition, cohorts help you connect product decisions directly to business outcomes. Changed your onboarding flow? Compare retention curves before and after the redesign. Added a new feature? See which cohorts actually adopt it and whether adoption correlates with lower churn. Rolled out a price increase? Cohorts show you which customer segments stayed loyal.
The real power is this: a 5% increase in customer retention can increase profits by 25-95%, and cohort analysis is how you identify and act on those retention opportunities. You move from guessing about customer behavior to seeing exactly which segments are your goldmines and which need intervention. That clarity drives strategy, not spreadsheet theater.
Key Metrics to Track in Your Cohorts
Once you've grouped your users into cohorts, the next question is obvious: what should you actually measure? Not all metrics matter equally, and tracking the wrong ones wastes time and clouds your decision-making.
Retention rate is the foundation. It answers the simplest question: are people coming back? Calculate it by dividing the number of active users in a cohort during a given period by the total number of users in that cohort when it started. Popular metrics for cohort analysis include retention rate, revenue per user, conversion rate, and engagement metrics like session frequency. If your retention drops steeply after week two, you've found a real problem worth investigating.
Revenue per user shows whether your cohort generates actual value. Divide total revenue from a cohort by the number of users in that cohort. This metric separates healthy growth from vanity metrics; a large cohort that generates minimal revenue per person isn't as valuable as a smaller, highly monetized one.
Customer lifetime value extends that thinking across the entire relationship. It's the total revenue you expect from a customer before they leave. This number helps you decide how much you can spend to acquire similar users.
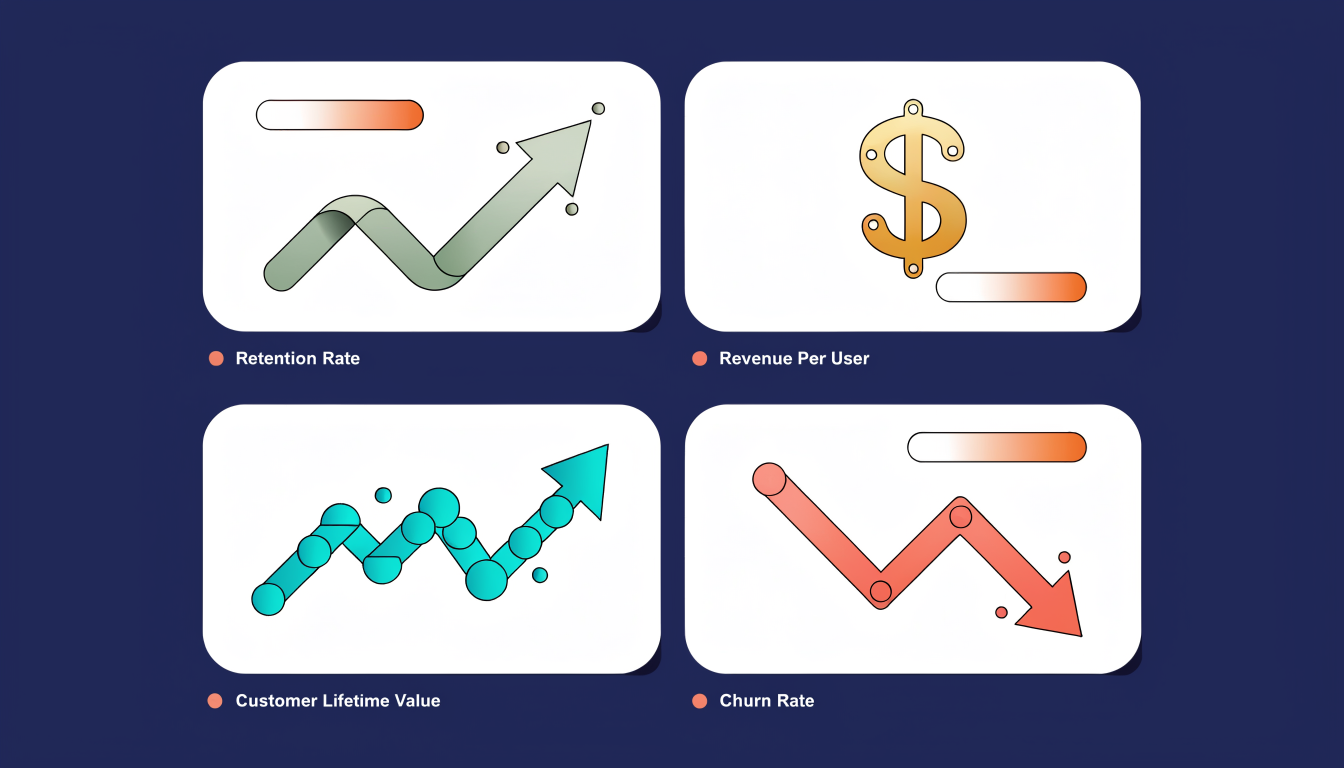
Churn rate is retention's mirror image: the percentage of users who stop using your product each period. It's easier to understand than retention for some teams. If 15% of your cohort churns monthly, that's immediately actionable.
Engagement metrics vary by business type. SaaS companies track session frequency; e-commerce focuses on repeat purchases; media platforms measure feature adoption. Pick metrics that directly reflect how users find value in your product.
Common Challenges and How to Overcome Them
Most businesses hit real obstacles when setting up cohort analysis, and acknowledging them is the first step toward solving them.
Data quality is the foundation everything else rests on. If your customer records have missing signup dates, incomplete purchase histories, or inconsistent user IDs across systems, your cohorts will be unreliable. Start by auditing your data now. Fix obvious gaps, establish naming conventions, and create processes to prevent future inconsistencies. Clean data takes effort upfront but saves you from chasing false patterns later.
New businesses face a different hurdle: you simply don't have enough history yet. You need at least several months of data to spot meaningful retention trends. In the meantime, focus on other metrics while you build your cohort foundation. Once you have six to twelve months of data, patterns will emerge.
Choosing which cohorts to analyze trips up many teams too. Should you segment by signup date, geography, acquisition channel, or product tier? With large datasets, the options feel endless. Start narrow. Pick one variable that directly connects to your business goals, run the analysis, and iterate. You don't need perfect segmentation on day one.
Interpreting results is where many teams get stuck. As analytics experts note, cohort analysis can produce a lot of data that's difficult to turn into actionable insights. Don't try to act on everything. Identify the most significant trend (like a 15% drop in month-two retention) and build one experiment around it.
Finally, remember that cohort analysis is inherently slow. Ecommerce teams face the reality that cohort analysis is a lagging metric; full lifecycle impact takes months to reveal. Patience matters here. Use it alongside faster feedback loops, not as your only decision-making tool.
Getting Started with Cohort Analysis: Your Action Plan
Ready to run your first cohort analysis? The process is straightforward once you break it into manageable steps.
Begin by identifying the specific business question keeping you up at night. Are customers churning after their first month? Do certain user segments spend more over time? Does onboarding speed affect retention? Your question shapes everything that follows, so be precise. As cohort analysis methodology emphasizes, the point is to generate actionable information you can actually use to improve your business.
Next, choose your cohort type. Acquisition cohorts group users by signup date; behavior cohorts track specific actions; segment cohorts divide customers by characteristics. Match your choice to your question.
Then select two or three metrics that directly answer your question. If you're investigating churn, track retention rate and time-to-churn. If engagement matters, measure feature adoption and session frequency. Resist the urge to track everything; focus beats noise.
Collect your data from your analytics platform or CRM, ensuring consistency and accuracy. Organize it into a cohort table where rows represent cohorts and columns show time periods or metrics. Visualize this data with simple charts; patterns emerge faster visually than in spreadsheets.
Now comes the detective work. Identify trends and anomalies. Why does one cohort outperform others? Form hypotheses about what's driving these differences. Then test your theories with targeted improvements, whether that's tweaking onboarding, adjusting pricing, or refining your messaging.
Finally, re-analyze after changes take effect. This cycle of hypothesis, action, and measurement transforms cohort analysis from interesting observation into competitive advantage. The right tools make this process smoother, which is why infrastructure matters more than you might think.
The Future of Cohort Analysis: From Manual Reports to AI-Driven Insights
Cohort analysis has proven its worth countless times over, yet most organizations still treat it like a manual chore. Teams spend weeks collecting data, organizing spreadsheets, building charts, and debating what the numbers actually mean. By the time insights emerge, business conditions have often shifted. The real problem isn't the concept; it's the execution gap between recognizing patterns and acting on them.
The good news: this is changing rapidly. Modern analytics platforms are automating the heavy lifting that once required dedicated analysts. Rather than waiting for quarterly reports, businesses now generate cohorts in seconds and watch patterns surface automatically. As Stripe's research shows, cohort analysis becomes the connective tissue for teams across product, marketing, success, and finance, anchoring conversations in what customers do.
What's genuinely new is the layer of intelligence being added on top. AI agents can now scan cohort behaviors, identify anomalies, and surface recommendations without anyone manually reviewing the data. A cohort of users showing churn signals might automatically trigger a targeted retention email. A high-value segment exhibiting specific behaviors could instantly feed into product prioritization workflows.
Privacy-first analytics platforms are also emerging to solve compliance concerns while maintaining insight quality. You can now run powerful cohort analysis without the data infrastructure headaches that plagued earlier approaches.
The future isn't about better spreadsheets. It's about cohorts that think, act, and evolve with your business. If you're still manually analyzing cohorts, you're leaving opportunity on the table. The time to modernize isn't next quarter; it's now.
Go deeper in the Learning Hub
Try Arktis free for 7 days
Attribution tracking, session recordings, and AI automation in one platform. Set up in 2 minutes, free for 7 days.
Start 7-day free trial