
User Journey Analytics: Ultimate Guide 2026
Last Updated: February 23, 2026 Key Takeaways User journey analytics connects scattered touchpoints into coherent stories revealing why customers drop off Three...

Last Updated: February 23, 2026
Key Takeaways
- User journey analytics connects scattered touchpoints into coherent stories revealing why customers drop off
- Three pillars drive success: data collection from all sources, identity resolution across devices, and visualization
- Modern tools empower non-technical teams to identify friction points and optimize experiences without coding
- Real-world results show 3x conversion improvements and 18% reduction in drop-offs through journey-focused strategies
What is User Journey Analytics? Definition and Core Concepts
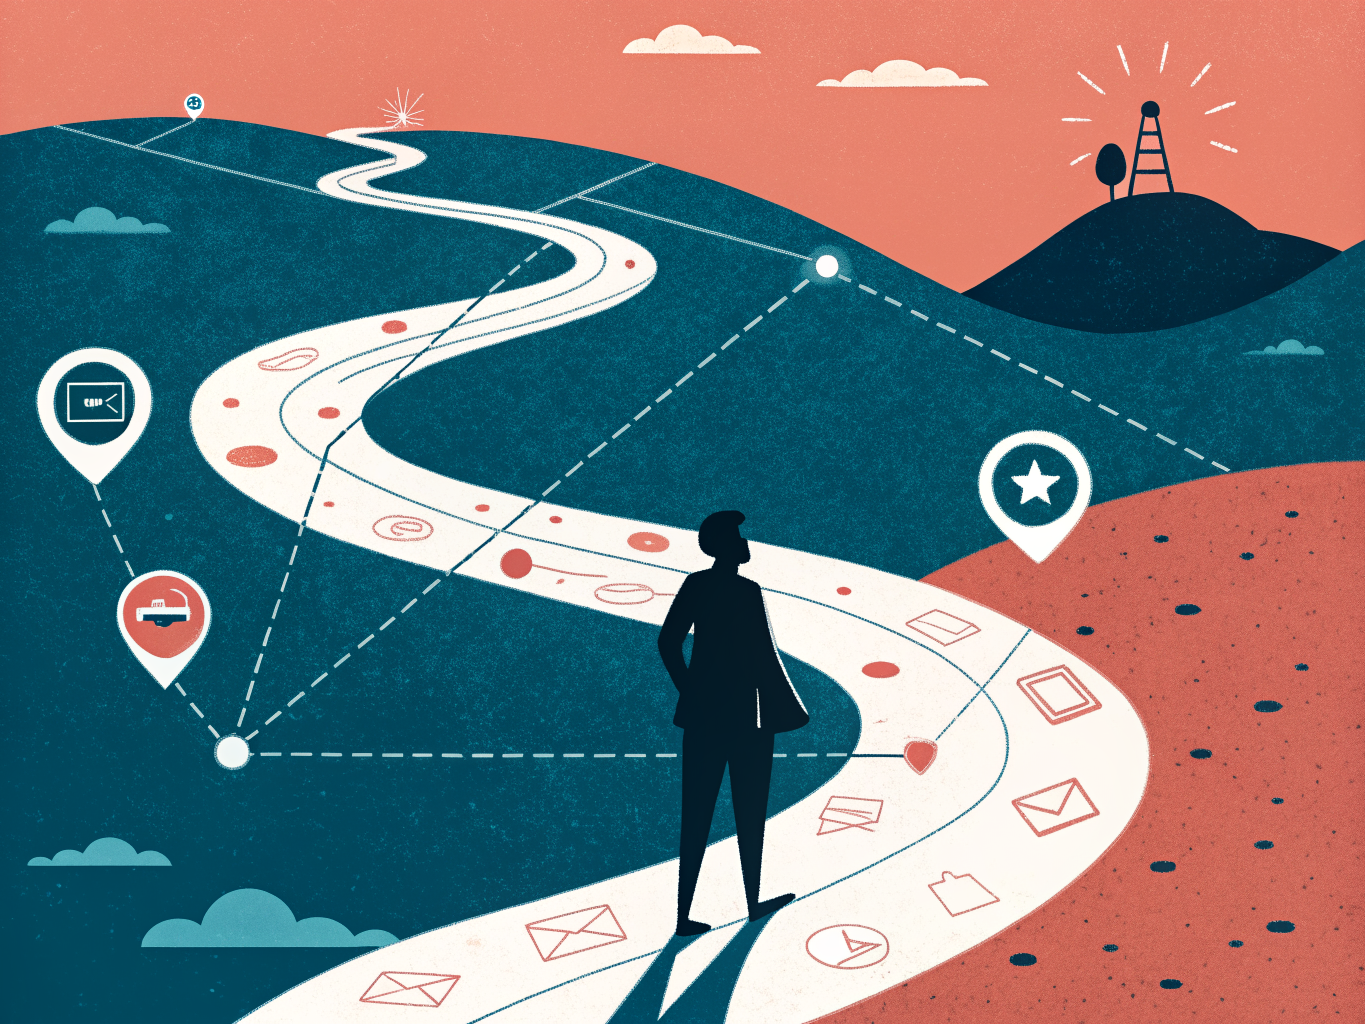
User journey analytics is the process of tracking and analyzing how visitors navigate through your website or app from their first interaction to conversion (and beyond). But here's what makes it different from the analytics tools you might already have: it connects the dots.
Traditional analytics typically show you the final outcome. You see that 1,000 people visited your site and 50 converted. You know the conversion rate. What you don't know is what those 950 people who didn't convert actually did. Where did they get stuck? What confused them? Which pages did they visit before leaving? Traditional analytics tools tell you what users did but rarely tell you why a user dropped off.
User journey analytics solves this by creating a complete narrative of each visitor's experience. Instead of isolated data points, you see the full path: the landing page they entered through, the product pages they browsed, the checkout steps where friction occurred, the email that brought them back, and finally the conversion. Every touchpoint matters because each one reveals something about your customer's decision-making process.
The core concept is simple but powerful: customer journey analytics connects every scattered touchpoint into a single coherent narrative. A visitor might interact with you across mobile, desktop, email, and social media. Traditional tools fragment this into separate reports. User journey analytics stitches it together.
This matters because friction points and drop-off moments are invisible in aggregate metrics. You need to see the actual paths people take, understand where they hesitate, and identify which experiences lead to success. That's where real optimization begins.
The Three Pillars of Effective User Journey Analytics
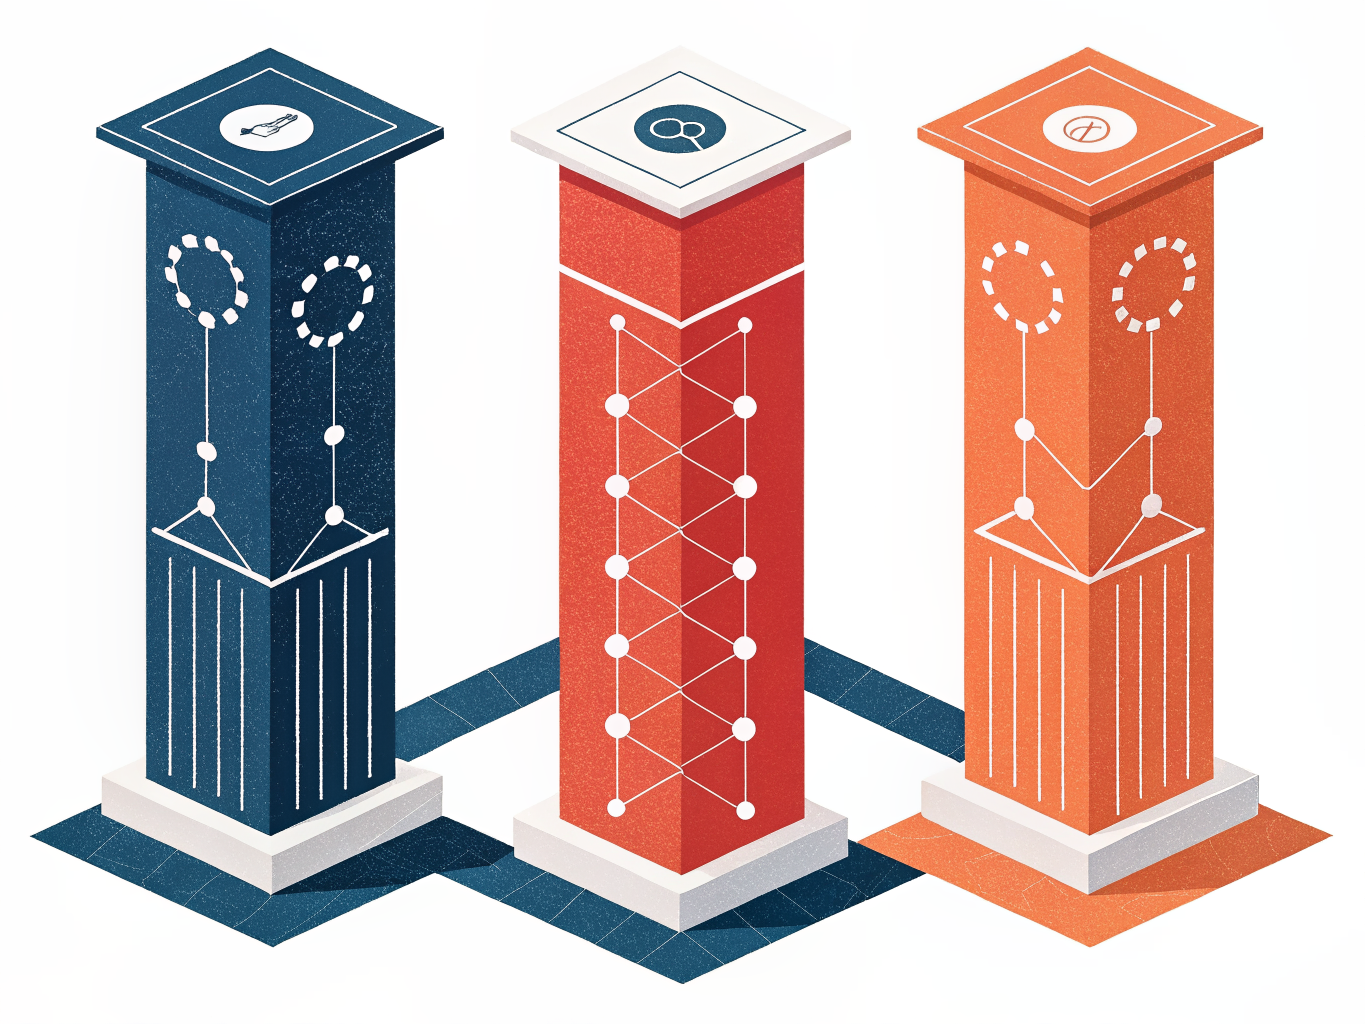
Think of user journey analytics like assembling a puzzle. You need the right pieces (data), a way to connect them (identity), and a clear picture when you're done (visualization). Miss any one, and you're left with an incomplete image that misleads rather than informs.
Pillar 1: Data Collection
The foundation starts here. You need to capture interactions across every channel where customers actually engage with you. That means website clicks and scroll depth, mobile app behavior, email opens and clicks, CRM notes, customer service interactions, and even offline touchpoints when possible. The key isn't collecting everything; it's collecting the right data strategically.
Consider a customer who researches your product on mobile during lunch, emails a sales question that evening, and completes a purchase on desktop the next morning. Without comprehensive data collection, you'd only see fragments of this story. You'd miss the research phase entirely, making your marketing attribution completely wrong.
Pillar 2: Identity Resolution
Here's where things get sophisticated. Identity resolution works like a detective, using identifiers like login IDs, email addresses, or probabilistic matching to stitch together all those fragmented interactions into a single customer timeline. This pillar transforms "anonymous visitor 47382" into "Sarah Chen, VP of Operations."
Without identity resolution, that multi-device journey we mentioned looks like three different customers. Your analytics team sees no pattern. Your marketing team can't nurture the prospect effectively. Your product team misses crucial insights about feature adoption.
Pillar 3: Visualization and Analysis
Raw data is useless. Visualization transforms numbers into stories that drive decisions. A well-designed journey map shows where customers drop off, where they accelerate, and which touchpoints actually influence conversion. It's the difference between "we have data" and "we understand our customers."
These three pillars depend on each other completely. Strong data collection means nothing without identity resolution to connect it. Perfect identity resolution becomes worthless if you can't visualize what the data reveals. Build all three equally, and you shift from fragmented metrics to coherent customer stories that actually change how you do business.
Identifying Drop-Off Points and Friction Points in Your User Journey
Here's the critical distinction: drop-off points are where users vanish entirely from your funnel, while friction points are where they struggle but might still convert if the experience improves. Understanding both changes how you prioritize fixes.
Drop-off points represent abandonment. A user adds items to their cart, then never returns. They start a signup flow and bail halfway through. Drop-off points are moments where users stop interacting completely, making them the most visible problem in your data. In ecommerce, the classic culprit is checkout: users abandon at payment when they discover unexpected shipping costs. In SaaS, it's often the trial onboarding where new users can't find core features.
Friction points are subtler but equally damaging. Users complete the action, but they take a convoluted path or require multiple attempts. A mobile checkout form with tiny input fields might cause users to tap back and forth repeatedly before finally converting. A SaaS product requiring users to toggle between three different screens to complete one task creates friction.
Here's how to identify each:
Set specific conversion goals in your analytics platform. Track completion rates by segment (device type, traffic source, user cohort). Use GA4's path exploration to reveal looping behavior, which signals users becoming stuck. Compare expected vs. actual paths: if 80% of users should reach checkout but only 20% do, you've found a drop-off point. If 90% reach checkout but take 8 steps instead of 3, that's friction.
One ecommerce team discovered their mobile checkout form was causing a 3x conversion improvement when redesigned for touch interfaces. That single friction point fix outperformed most other optimizations combined.
Start by mapping your ideal user journey, then overlay actual behavior data. The gaps tell the story.
Best Tools and Platforms for User Journey Analytics in 2026
The user journey analytics market in 2026 offers something for every business type, but choosing wisely depends on understanding what each platform actually does well.
Specialized tools dominate when you need deep behavioral insights. Heap excels at autocapture, meaning Heap's autocapture ensures no user interaction is missed, enabling retroactive analysis of any journey. This matters if you've launched tracking halfway through a project; you can still analyze historical data. Mixpanel shines for understanding user flows, particularly for mobile and product-focused companies. Mixpanel's Flows report provides intuitive visual representation of most common paths users take, making it simple to spot where users drop off. Fullstory combines session replay with journey mapping, giving you both the what and the why behind user behavior, though it typically costs more.
Google Analytics 4 remains the accessible starting point. GA4's event-based tracking lets you track specific interactions like clicks and form submissions, while path exploration and funnel analysis handle basic journey visualization. For companies already invested in Google's ecosystem, GA4 often delivers 70% of what you need at zero additional cost.
The real differentiator across platforms is ease of use. Modern tools have democratized analytics; tools now empower non-technical users to build funnels and segments without writing code. This shift matters more than it sounds. Your product manager or content team can now answer their own questions rather than waiting for engineering resources.
When evaluating options, consider your primary use case. Ecommerce teams typically benefit from Mixpanel's conversion tracking and cohort analysis. SaaS companies often prefer Fullstory for understanding user struggle points during onboarding. Content-heavy sites usually find GA4 sufficient unless they need advanced behavioral segmentation.
Pricing varies dramatically. GA4 is free; specialized tools range from $500 to $5,000+ monthly depending on data volume. Don't just chase the cheapest option. A tool that requires constant custom configuration costs you in hidden engineering time. The best choice integrates smoothly with your existing stack, matches your team's technical capability, and answers the specific questions keeping you awake at night.
Implementing User Journey Analytics: A Step-by-Step Approach
Getting user journey analytics up and running doesn't require a complete overhaul of your existing systems. It does, however, require intention and patience. Here's how to build it methodically.
Start with your most critical journeys. Don't try to track everything at once. Identify three to five essential user paths: checkout, signup, onboarding, feature adoption, or whatever drives your business. These become your foundation. Once you've mastered tracking these flows, expanding becomes straightforward.
Set up comprehensive event tracking next. You need visibility into every meaningful interaction across your website, app, and email. GA4's event-based tracking model and cross-device capabilities provide detailed view of user interactions over time, making it a solid starting point for most teams. The key is consistency: define what constitutes a "click," "view," or "conversion" and stick with it. Messy event naming creates analysis headaches later.
Implement identity resolution to close the device gap. Users bounce between phones, tablets, and desktops. User ID implementation allows tracking across devices by connecting sessions from different devices under single user, giving you complete visibility into fragmented behavior. This step separates basic analytics from true journey understanding.
Visualize your data and establish baselines. Create journey maps showing where users drop off, how long steps take, and which paths convert best. These visualizations help your entire team understand customer behavior, not just analysts.
Then comes the real work: testing. Identify friction points (that confusing checkout page, the onboarding flow nobody completes) and run experiments. Small improvements compound. A 2% reduction in checkout abandonment might seem modest until you calculate the revenue impact.
The timeline varies by company size and complexity. Small teams might complete this in weeks; larger organizations need months. That's normal. The important part is moving forward consistently rather than waiting for perfect conditions.
Real-World Impact: Case Studies and Success Metrics
When companies actually implement journey analytics, the results speak for themselves. One retail organization discovered that their mobile checkout experience was hemorrhaging customers; they weren't losing people at awareness or consideration, but right at the final step. By mapping the complete journey and identifying friction points, they restructured the mobile flow. Conversions jumped from 1.2 percent to 4.7 percent, a 3.9x improvement, without spending more on traffic acquisition.
The insight? They weren't attracting the wrong people. They were losing the right ones.
A financial institution took a different approach. They used journey analytics to track where prospects dropped during onboarding, then segmented messaging based on where each person got stuck. Financial institution reduced onboarding drop-offs by 18% through personalized messaging informed by journey mapping. That single change moved thousands of qualified leads across the finish line.
Here's something that surprised many teams: a global retailer found that customers contacting chat support within 24 hours of viewing their return policy were twice as likely to complete a purchase. That insight alone changed how they allocated support resources and when they triggered proactive outreach. Research shows this kind of behavioral signal matters more than you'd expect.
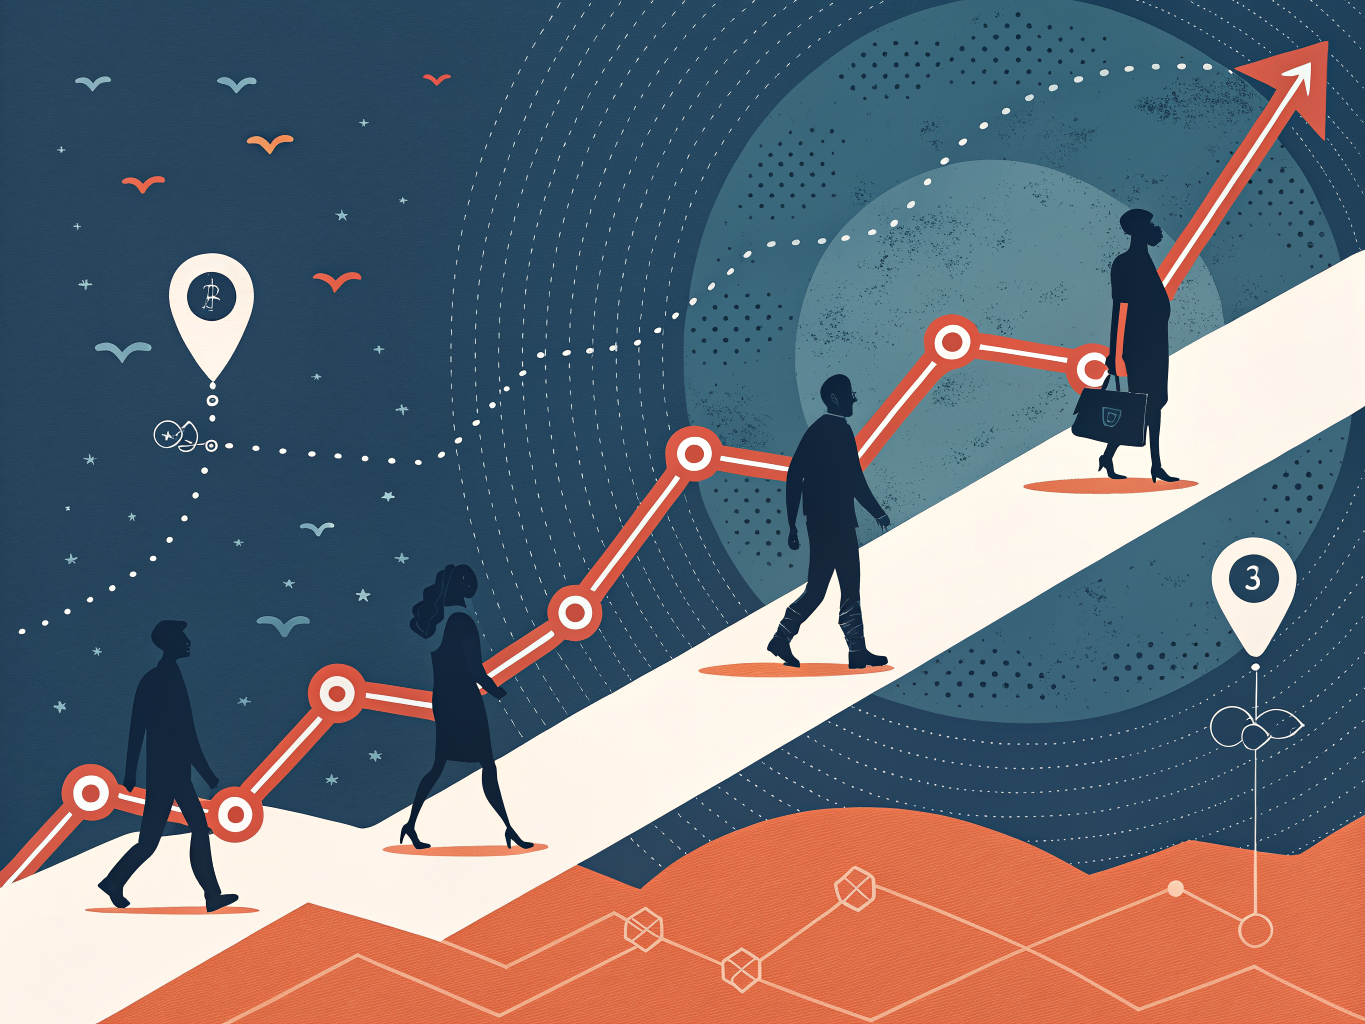
The pattern across these examples: revenue improvement doesn't require more visitors. It requires understanding the ones you already have. Journey analytics reveals where your existing traffic is getting stuck, and fixing those bottlenecks moves the needle faster than any acquisition campaign ever could.
Key Takeaways and Getting Started with User Journey Analytics
User journey analytics transforms how businesses understand customers. Instead of viewing isolated touchpoints, you see the complete picture: where visitors arrive, what stops them, and why they convert or leave. This shift from fragmented data to unified customer stories drives measurable results, with companies reporting 3x+ conversion improvements after optimizing their journeys.
Here's what matters most:
Data collection, identity resolution, and visualization work together. Skip any pillar, and your insights collapse. You need clean data, the ability to recognize the same person across devices and channels, and dashboards that tell the story clearly.
You don't need a data science degree. Modern platforms put journey analytics within reach of marketing, product, and operations teams. If you can read a dashboard, you can use these tools effectively.
Start small and specific. Don't try to map every possible customer path at once. Pick your most critical journeys: the signup flow, the checkout process, or the onboarding sequence. Measure the baseline, identify where friction exists, then test improvements systematically.
Friction points are everywhere. Confusing navigation, unexpected form fields, slow load times, unclear value propositions. Journey analytics reveals which friction actually matters because you see the impact on behavior.
Next steps: Audit your current data sources. Define three critical journeys. Set baseline metrics. Then start watching how your customers actually move through your product. The insights will guide every decision that follows.
Frequently Asked Questions About User Journey Analytics
Q: How is user journey analytics different from traditional Google Analytics?
Google Analytics shows you aggregate traffic patterns; user journey analytics reveals why individual customers behave the way they do. While GA tells you that 40% of visitors dropped off at checkout, journey analytics shows you the specific sequence of actions, page views, and time gaps that preceded that abandonment. You see the actual path, not just the exit point.
Q: Do I need technical expertise to implement journey analytics?
Not anymore. Modern tools empower non-technical users to build funnels and segments without writing code. Most platforms offer drag-and-drop interfaces where marketers and product managers can map journeys independently. You'll want technical support for initial setup and data connections, but day-to-day analysis doesn't require engineering skills.
Q: How long does it take to see results?
You'll spot obvious friction points within 1-2 weeks. Meaningful insights that drive strategy take 4-6 weeks as patterns emerge across larger sample sizes. Real business impact typically appears after 2-3 months when you've implemented changes based on your findings.
Q: What about data privacy?
Ensure your tool complies with GDPR, CCPA, and your industry standards. Most reputable platforms handle anonymization and consent management. Review their privacy documentation before implementation.
Q: How do I measure ROI?
Track conversion rate improvements, reduced drop-off at key stages, and customer lifetime value changes. Compare metrics before and after implementing journey insights. Most companies see 15-30% conversion improvements within six months.
Q: Free or paid tools?
Free options work for basic analysis. Paid solutions scale better, offer deeper segmentation, and integrate more seamlessly with your tech stack.
Start Mapping Your User Journey Today
The data is clear: companies that map user journeys make better decisions. Those that don't are operating blind, making choices based on assumptions rather than evidence. Your competitors aren't waiting, and neither should you.
The good news? You don't need a massive budget or years of technical expertise to start. Begin with your highest-impact user journeys, the ones directly tied to revenue or retention. Map what happens today, identify the friction points, and measure the improvements you make tomorrow. That's it. That's the foundation.
The tools exist. The methodology is proven. Thousands of companies have moved from fragmented touchpoint data to cohesive customer stories, and they're seeing real results: fewer drop-offs, higher conversions, better customer loyalty.
Your first step is simpler than you think. Choose one critical journey this week. Start collecting data. Watch how your understanding shifts when you see the complete picture instead of isolated metrics. That momentum builds quickly.
User journey analytics isn't a future initiative anymore. It's happening now. The question is whether you're leading the change in your industry or catching up to those who already are.
Go deeper in the Learning Hub
Try Arktis free for 7 days
Attribution tracking, session recordings, and AI automation in one platform. Set up in 2 minutes, free for 7 days.
Start 7-day free trial